Drawing a legend: the Legend function
Most relevant parameters of the legend function:
x, y: location in the graph
legend: character vector specifying the labels, placed on the right side of the legend box
- one of the following parameters has to be used for the symbols, placed on the left side of the legend box
fill: filling color of a small box
col, pch: line color and type of points
# example with a barplot

x.mx <- matrix (data = c (c (1, 2, 3, 4, 2, 3), c (1.4, 2.5, 3.1, 4.2, 2.8, 3.9)), nrow = 2, ncol = 6, byrow = F)

x11()
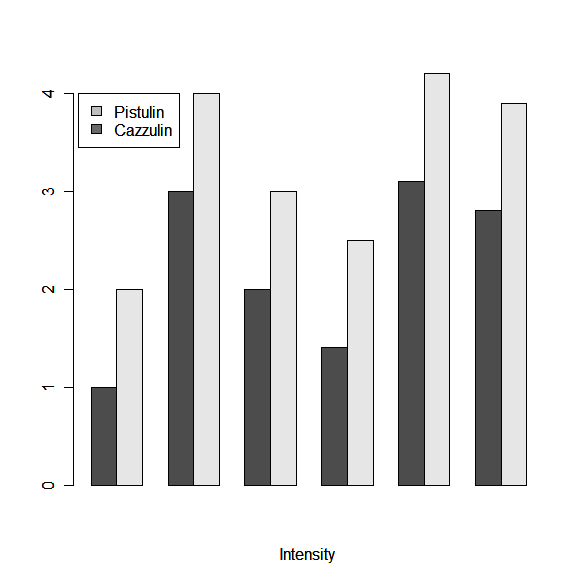
barplot (x.mx, xlab = "Intensity", beside = T)
legend (x = 0.5, y = 4, legend = c ("Pistulin", "Cazzulin"), fill = c ("grey", "dimgrey"))
This is the picture you get: 
# example with a scatterplot

points1.mx <- matrix (data = c (c (1, 2, 3, 4, 2, 3), c (4, 2, 1, 4, 1, 5)), ncol = 2, nrow = 6, byrow = F)
points2.mx <- matrix (data = c (c (1.5, 2.5, 3.5, 4, 2.5, 3), c (3.5, 2.5, 1.5, 3, 1.5, 4.5)), ncol = 2, nrow = 6, byrow = F)

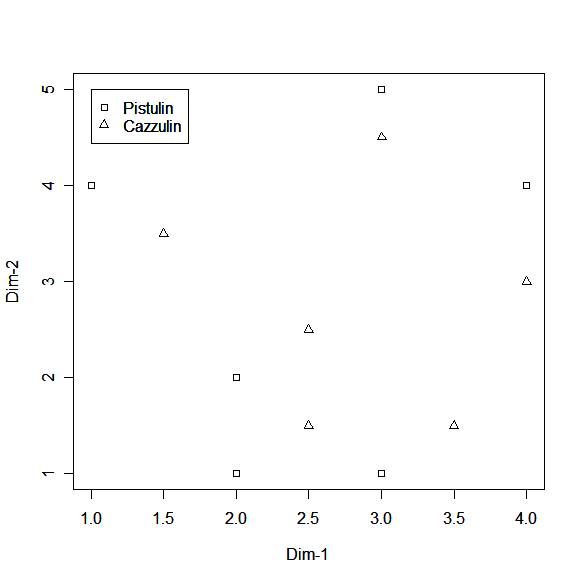
plot (points1.mx[, 1], points1.mx[, 2], pch = 22, xlab = "Dim-1", ylab = "Dim-2")
points (points2.mx[, 1], points2.mx[, 2], pch = 24)

legend (x = 1, y = 5, legend = c ("Pistulin", "Cazzulin"), col = c ("black", "black"), pch = c (22, 24))
This is the picture you get: 