OICR Cancer Stem Cell program - Pathway and Network Analysis Service
The Pathway and Network Analysis Service is freely available to all OICR Cancer Stem Cell program members.
Goals of the service
High-throughput genomic experiments (e.g. gene expression, large-scale genetic screens) often lead to the identification of large gene lists. The interpretation of results and the formulation of consistent biological hypotheses from these gene lists can be challenging. Pathway and network analysis (e.g enrichment analysis) approaches can aid interpretation by relating the gene list to knowledge about the biological system, such as pathways.
Our goal is to help researchers interpret results of genomics experiments. Analysis is conducted in close collaboration with researchers on each project to ensure correct input data and effective interpretation of results. Ideally researchers do as much of the analysis and interpretation as they can.
We are also focusing on developing training materials and sessions to help researchers who are interested to perform these bioinformatics analyses themselves. Examples of published pathway maps and list of tutorials that could guide researcher can be found following this link: RESOURCES AND EXAMPLES.
Standard types of pathway analysis offered
Pathway and network analysis: find pathways enriched in a list of genes (e.g. differentially expressed genes)
Gene-set enrichment analysis helps characterize large gene lists by finding functionally coherent gene-sets, such as pathways, that are statistically over-represented in a given gene list. We have also developed a method to visualize the results of this analysis, called Enrichment Map. Enrichment Map organizes gene-sets in a network and it enables the user to quickly identify the major enriched functional themes. Input: gene list from genomics experiment (statistically analyzed). Output: enriched pathways visually displayed.
Example of pathway and network analysis: (MORE EXAMPLES)
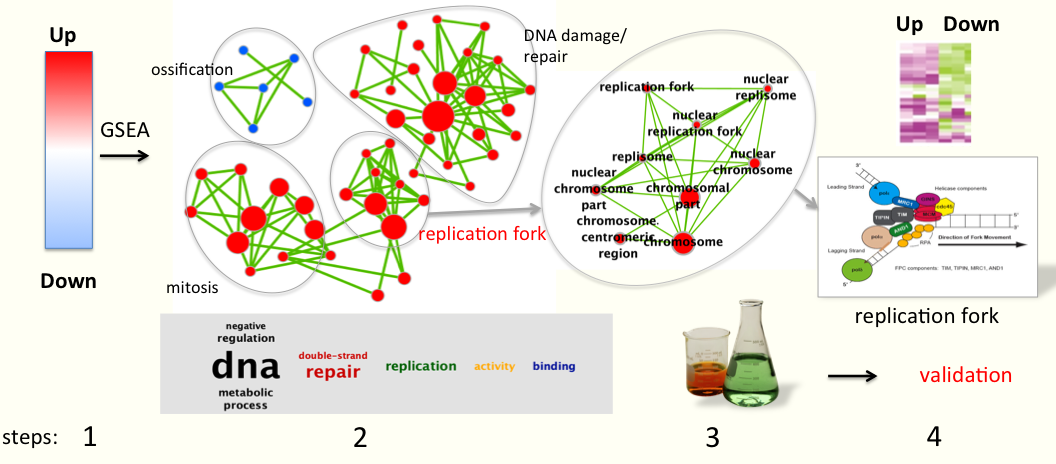
- A typical example (see figure below the text) comes from gene expression data comparing treated samples versus non-treated samples. The first step is to identify differential gene expression using statistics: genes are ranked using t-test t values with up-regulated genes at the top of the list and down-regulated genes at the bottom.
- Next, GSEA is run to find out if gene-sets contain mostly up or down-regulated genes. [Gene-sets are a group of genes that have been annotated to have a similar biological function or belong to the same biological pathway e.g. mitosis and are collected from multiple databases].
- Then, Enrichment map helps visualize all the gene-sets that are significantly enriched in the treated (red circles) or in the non-treated samples (blue circles). [Each gene-set is represented by a circle, also known as a node]. If gene-sets have similar annotations, they cluster together on the map [e.g. all gene-sets related to chromosome condensation and replication fork cluster together] which ease interpretation of the map. In this example, many gene-sets related to mitosis and DNA replication/damage, or involved in the replication fork complex, are enriched in the treated samples (red nodes, genes in these gene-sets are mostly up-regulated). Gene-sets involved in ossification/bone morphogenesis are enriched in the non-treated samples (blue nodes).
- As a result, the analysis output summarizes all of the known biological function/pathways that are changing in a particular experiment and more detailed analyses can be performed as a next step to validate or to generate new hypotheses.

Predict the function of an unknown gene GeneMANIA finds other genes that are related to a set of input genes, using a very large set of functional association data. Input: a gene or set of genes. Output: connections between input genes and suggestions for additional related genes.
Related publications: GeneMANIA
We are interested in discussing custom analysis - it is how we learn what you need.
Statistical Analysis
- Pathway and network analysis comes when a gene list has been generated from high throughput OMICs experiments and needs to be functionally interpreted. The data should have then been already statistically analyzed. If your list contains true positives, you are going to be more confident about the output of the pathway analysis. On the other hand, if the gene list contains more noise, we will have to be more cautious about the interpretation of the results and it will also require additional analyses that will delay the overall process of interpretation. Experience is showing us that taking a lot of care in the early steps of the statistical analysis -- by using the statistical method that best fit your data including normalization or removing outliers -- improve the pathway and network analysis results. For these reasons, we have also developed a biostatistics service that can help you if you need to choose a method or process your data in a correct format for subsequent pathway and network analyses:
Please look at http://www.baderlab.org/CSCBiostatService for more information.
You are also encouraged to contact us as soon as you plan your experiment: genomics technologies can be very sensitive to noise and a well designed experiment is very important for best results. Statistical consultation at the design stage is crucial for improved data quality and results.
How to use the service
Please follow THIS LINK to get more details about what to expect from the service and suggested data requirements.
Link to Tutorials
Please follow THIS LINK to get some Enrichment Map examples , some tutorial slides, workflows and tips.
Contact Dr. Veronique Voisin (Ph.D Biology) veronique.voisin@gmail.com
