GSEA parameters
Required fields

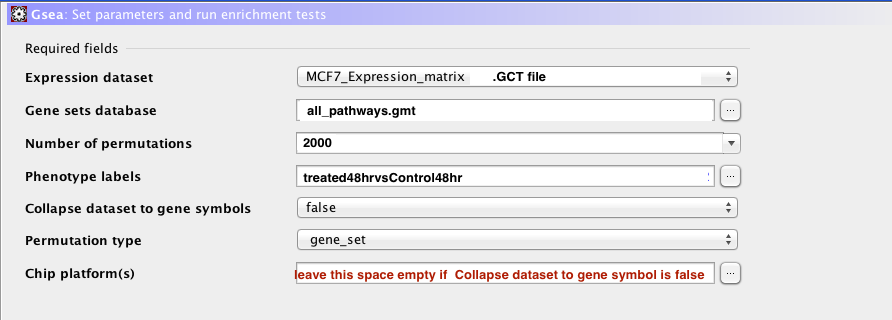
- Expression dataset: contains the normalized data in a .GCT format
- Gene sets database: contains information about all the pathways that are going to be tested. We use the Baderlab collection for this exercise but Msig databases are also available here.
- Number of permutations: 100 for a short run time for practical reason during this lab: use 1000 or 2000 in real life! It is used to calculate the significance of the enrichment, i.e the calculation of the pvalue and FDR.
- Phenotype labels: tells GSEA which 2 groups of samples we would like to compare (treated at 12hours and non treated at 12 hours in this exercise)
- Collapse dataset to gene symbols: set to false in this exercise because we already substituted probe ID by Gene Symbol in the GCT file while preparing files for this lab. If you have probe id as your first column and not the gene names, set Collapse dataset to gene symbols to true and choose the corresponding Chip platform.
- Permutation type: set to gene-set as we don’t have enough samples to run successfully phenotype permutation (try phenotype permutation if you have more than 20 samples per group of comparison)
- Chip platform(s): stays empty if Collapse dataset to gene symbol if set to false. Otherwise, you need to retrieve your chip model using this link.
Basic fields

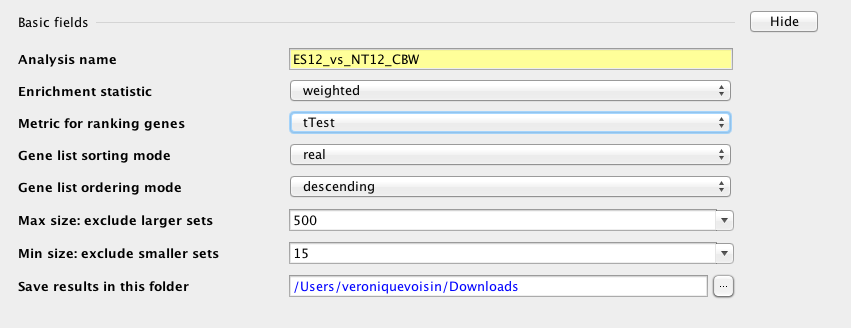
- Analysis name: self explanatory
- Enrichment statistic : weighted is the default and is equivalent to a weight of 1. the genes that are top ranked will contribute with a greater amplitude to the enrichment score. It is a good idea to change the weight to p2 for noisier data to increase confidence about the results. It is not recommended to use a weight of 0.
- Metric for ranking genes: ‘tTest’ is recommended. A fold change metric can be tried for noisy data where no significant results could be obtained using the t-test (Ratio_of_Classes for linear data format and Diff_of_Classes for log scale data format).
- Gene list sorting mode: ‘real’ means that genes associated with with positive t values will be ranked at the top of the gene list and genes with negative t values at the very bottom of the list. It indicates that we are looking for enrichment in gene-sets separately for genes that are up-regulated (positive phenotype) and genes that are down-regulated (negative phenotype). If you are interested to look for enrichment in genes differentially expressed regardless of up- or down-regulation, set the sorting mode to’ abs’.
- Gene list ordering mode: set to descending. It will rank the list from positive t values at the top of the list to negative t values at the bottom. Ascending will do the reverse.
- Max size: exclude larger sets: set to 500. Larger gene-sets may be too generic to be informative. It could correspond to higher level terms such as ‘cell’, ‘plasma membrane’ or ‘biological process’
- Min size: exclude smaller sets: set to 15. GSEA statistics will not be reliable for gene-set containing a small number of genes.
- Save results in this folder: self explanatory.
Advanced fields

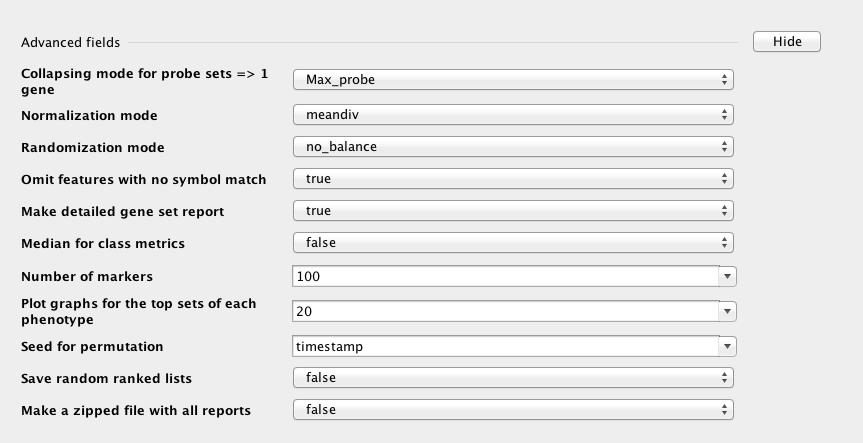
Collapsing mode for probe sets => 1 gene: Max_probe . On a chip (Illumina or Affymetrix) multiple probes are designed to target a same gene. However, no duplicated genes are allowed in the data when gene-set enrichment is performed. Max_probe will select the probe with the highest rank.
Normalization mode: meandiv. It used to calculate the normalized enrichment score (NES) from the enrichment score (ES). (http://www.broadinstitute.org/gsea/doc/GSEAUserGuideTEXT.htm#_Normalized_Enrichment_Score)
- Randomization mode: no_balance. Method used to normalize the enrichment scores across analyzed gene sets. It us not used when ‘Permutation type’ is set to ‘gene-set’.
- omit features with no symbol match: Used only when collapse dataset is set to true. By default (true), the new dataset excludes probes/genes that have no gene symbols.
- make detailed gene set report: Create detailed gene set report (heat map, mountain plot, etc.) for each enriched gene set.
- median for class metrics: Specifies whether to use the median of each class, instead of the mean, in the metric for ranking genes. Default: false
- number of markers Number of features (gene or probes) to include in the butterfly plot in the Gene Markers section of the gene set enrichment report. Default: 100
- plot graphs for the top sets of each phenotype Generates summary plots and detailed analysis results for the top x genes in each phenotype, where x is 20 by default. The top genes are those with the largest normalized enrichment scores. Default: 20
- random seed: Seed used to generate a random number for phenotype and gene_set permutations. Timestamp is the default. Using a specific integer valued seed generates consistent results, which is useful when testing software.
- save random ranked lists: Specifies whether to save the random ranked lists of genes created by phenotype permutations.
- output file name Name of the output file. The name cannot include spaces.
