|
Size: 8934
Comment:
|
Size: 9041
Comment:
|
| Deletions are marked like this. | Additions are marked like this. |
| Line 40: | Line 40: |
| * Download here: COMING SOON | * Download here: [[attachment:HyperModules_Cytoscape_1.0.zip]] |
| Line 86: | Line 86: |
| * Double click on ''' any row ''' in the table to view a graph of the Kaplan-Meier Survival Curves associated with the module (patients associated with the module versus all of the patients in your dataset). | * Click ''' Display Chart ''' with a row selected in the table to view a graph of the Kaplan-Meier Survival Curves associated with the module (patients associated with the module versus all of the patients in your dataset), or a barplot of Expected vs. Observed for fisher's test. |
HyperModules App
Description
HyperModules is a biological interaction network analysis algorithm to analyse gene mutations and clinical information. Specifically, HyperModules uses local graph search heuristics to detect closely connected gene network regions (i.e. network modules) in which gene mutations correlate with clinical features. Clinical features comprise time values like patient survival, or discrete values like tumor stage. To establish statistical significance of clinical correlations in detected modules, HyperModules applies standard tests (Log-rank test, Fisher's exact test). In addition, searches are repeated across many shuffled networks to correct for systematic biases originating from underlying network structure.
HyperModules was designed by Jüri Reimand and Gary Bader. The tool was recently and re-written in Java and implemented as a command line tool and a CytoScape App by Alvin Leung, as part of Google Summer of Code 2013. For more info, please consult the original paper in Molecular Systems Biology (2013).
HyperModules uses three types of input data:
- The interaction network - a two-column text file of gene-gene pairs [EXAMPLE].
- Gene mutations - a two-column CSV file of gene-patient pairs showing patient IDs with mutations in genes [EXAMPLE].
- Clinical information - a multi-column CSV file of clinical information, in which one column contains patient IDs common to gene mutation data [EXAMPLE].
Command-Line Version
QUICK START: Download the zip file below, unzip, navigate to the folder, and run the following command:
java -jar HyperModules-1.0.jar -n example/network_interaction_data.csv -c example/clinical_data.csv -s example/mutation_data.csv
Download here: HyperModules_CommandLine_1.0.zip
The lightweight command line version of the app is implemented in Java and compiled as an executable jar. To run, please ensure you have the latest version of Java installed on your machine. Then, navigate to the folder containing the jar file and run with the following command:
USAGE: java -jar [*.jar] [-n network_interaction_file] [-s samplemutationdata] [-c clinicaldata] [-t statistical_test] [-S shuffle_number] [-C numberofprocessors] [-p pvaluecutoff]
The shuffle number parameter should be between 1000 and 10000, and the statistical test parameter is either "logrank" for survival data or "fisher" for data for a clinical variable. For example, using the attached example input files, assuming we have survival data and we want to do random shuffling of mutation associations 1000 times for accurate FDR discovery rate p-values, we run something that looks like this:
java -jar HyperModulesCommandLine-0.0.1-SNAPSHOT-jar-with-dependencies.jar -n /Users/user/HyperModules/allinteractions.csv -s /Users/user/HyperModules/mutation_data.csv -c /Users/user/HyperModules/clinical_data.csv -S 1000 -t logrank -p 0.05
After the algorithm has finished running (NOTE: THIS MAY TAKE A LONG TIME, DEPENDING ON THE DENSITY OF THE TOPOLOGY OF THE INTERACTION NETWORK AND THE SIZE OF THE MUTATION DATA), the results will be printed to stdout, while the program messages will be printed to stderr.
Cytoscape App Version
Download here: HyperModules_Cytoscape_1.0.zip
A sample cytoscape session file and 3 sample input files and included.
The full version of the app is implemented as a Cytoscape 3.X App (plugin). It will not work on earlier versions - to use, please sure you have the latest version of Cytoscape (Download here)!
To install the app,
Go to the menu bar and click on Apps and then select App Manager
From here, either use Search to search for the App on the Cytoscape App Store, or choose Install from File to install the compiled version attached below
Click Install from File , select the jar file in your local folder and select it.
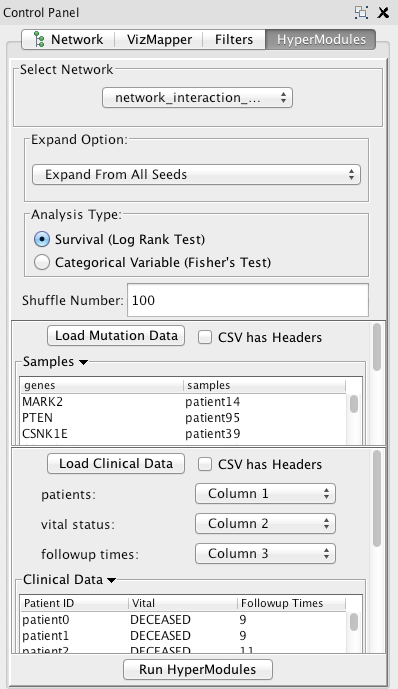
Once the app has been installed, go to Apps and select HyperModules from the dropdown, and then click Open . The main panel should appear as a new tab in the left control panel of Cytoscape. To close the panel (and dispose of all results!), click Close . If you click visualize, you can visualize a small portion of the interaction network currently selected in the Cytoscape viewer. To use it, enter a string into the text field of node names separated by commas and click execute (eg. "GENE1,GENE2,GENE3"). Here follows a brief overview of the options:

In the Select Network panel, select the gene/protein interaction network that you want to run the algorithm on (if you already have one loaded in the cytoscape viewer). To add an interaction network to cytoscape, go to File -> Import -> Network -> File... .
In the Expand Option panel, the default is to run the algorithm on all the seeds (every node in the network with at least one patient with that associated mutation). Select Expand from selected seeds in order to only run the algorithm on the seeds that are currently selected (highlighted) in the Cytoscape network visualization window.
For Analysis Type , select either Survival or Discrete Variable
For Shuffle Number , enter a number between 0 and 5000. We recommend that you run the algorithm on a shuffle number of 1000.
In the Load Mutation Data panel, click on the button in order to load the mutation data file. Please follow the attached file to properly format your input file. There should be two columns - the first is all the gene/protein names, and the second is all the patients associated with (that have a mutation in) that gene. If there is no patient associated with that gene, it should be blank or it should say "no_sample". After you select the file, it should appear in the table that you can scroll through. Uncheck the CSVHeaders option if your input file (CSV or TSV) doesn't have headers. ".maf" files are also acceptable input.
In the Load Clinical Data panel, click the button to load either clinical survival data (if you are running the log-rank test) or clinical variable data (if you are running fisher's exact test). After the file is loaded, it should appear in the scrollable table. By default, the first three columns of the CSV or TSV file will be used as the data.
- For Survival Analysis, the first column should have all your patients, the second column should indicate their vital status (DECEASED/ALIVE, Y/N, or 1/0), and the third column should be the days to the last followup of the patient.
- For Discrete, the first column should have all the patients, and the second column should have the patient's status with regards to the clinical variable of note. NOTE: if there are more than two kinds of values here, it may take a long time (fisher's exact test uses 2x2 tables by default).
- To change the column for input data, select the appropriate column from the dropdown menu (which will display all of the columns in your input file). The changes will show up in the scrollable table.
Once everything is properly loaded, click Run Algorithm . Again, this might take a long time depending on the topology of your interaction network and the size of the data.
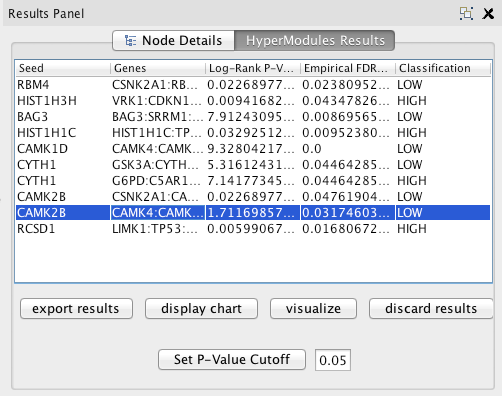
- When the algorithm is finished running, a panel should pop up in the right hand side in the Cytoscape results panel. Click the button with the triangle to get to the panel if you can't see the results panel.

The table lists all the most correlated modules, subject to a p-value cutoff. Enter a new value in the text field and click Set P-Value Cutoff to change the cutoff.
Click Export Results to export the results into a csv file with all the data subject to the current cutoff (select a cutoff of 1 to save all data).
Click Visualize Network to view the network module of the row currently selected in the table. It will pop up as a new Cytoscape network.
Click Display Chart with a row selected in the table to view a graph of the Kaplan-Meier Survival Curves associated with the module (patients associated with the module versus all of the patients in your dataset), or a barplot of Expected vs. Observed for fisher's test.
Click Discard Results to exit the results panel.
Sample Input Files
Please consult the following example files as a reference for the accepted format of the input files. Comma-separated values and tab-separated values are valid for input - avoid having any blank cells in your file.
Example files - Example input
