|
Size: 2992
Comment:
|
Size: 4050
Comment:
|
| Deletions are marked like this. | Additions are marked like this. |
| Line 29: | Line 29: |
| * {{attachment:GSEA_explanation_Wang_Murray.png}} | |
| Line 40: | Line 41: |
| === FAQs === | === answers to questions === * Question: how can we compare the NES (same gene-sets) between different datasets: * 1) single sample GSEA case: e.g single sample GSEA was used on several patients and then a matrix of NES is created with the gene-sets as rows and patients as column and you want to find out gene-sets that are comparable between patients. A t-test with 1 group could be used to identify the gene-sets with comparable NES throughout samples --> t = mean/ standard error. The gene-sets will get a pvalue close to 0 only for gene-sets with comparable NES across patients (standard error is going to be small) * 2) GSEA has been run using GSEA preranked option, you created a map using the 2 datasets and you see that the map is similar (e.g JAK2 responders versus partial responders) (high correlation throughout the gene-sets for the 2 datasets). You can do a K_S (Kolmogorov–Smirnov) test or a Wilcoxon rank sum test on the NES from the 2 datasets to see if "the 2 maps" are different or not. |
GSEA Gene Set Enrichment Analysis (www.broadinstitute.org/gsea )
link to GSEA documentation: the format section will explain you how to format your data as .rnk file, a .gmt file or an expression file.
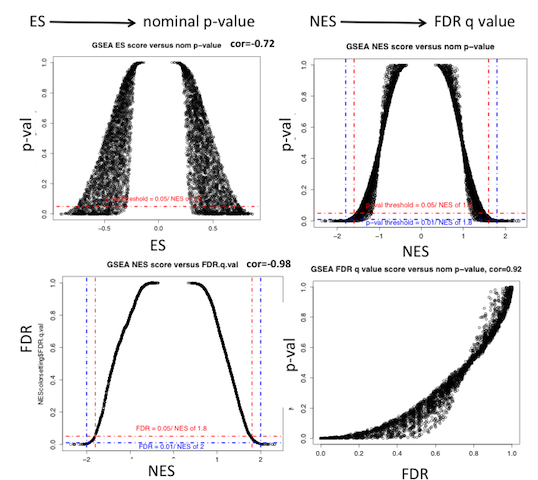
quick guide to GSEA interpretation of the results
- which values to consider for interpretating results:
number of gene-set tested |
1 gene-set |
few gene-sets (3-10) |
a lot of gene-sets >3000 |
ES |
|
not recommended |
not recommended |
NES |
not informative |
|
|
nom p-value |
|
better to use FDR |
better to use FDR |
FDR |
not informative |
|
|
(*) FDR values are going to be pessimistic due to the high number of tested gene-sets and therefore the high p-value adjustment needed.
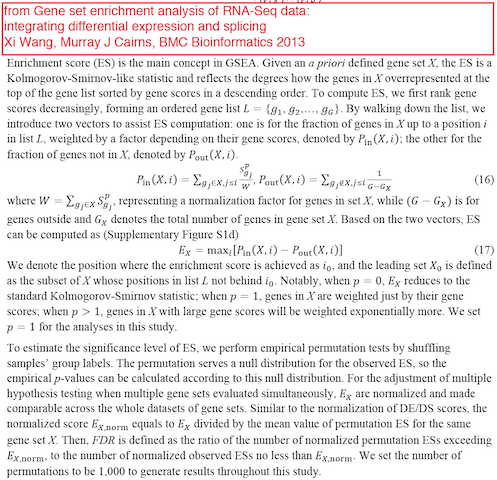
- ES (enrichment score): reflects the degree to which a gene-set is overrepresented at the top or bottom of a ranked list of genes.
- NES (normalized enrichment score): NES corrects for differences in ES between gene-sets due to differences in gene-set sizes. It enables to compare the scores of the different tested gene-sets with each other.
- NES = actual ES / mean of all ESs obtained from all random permutations for the single gene-set that is being tested
- nom p-value: The nominal p value estimates the statistical significance of the enrichment score for a single gene set. THe p-value is calculated from the null distribution.
- Using gene-set permutation, the null distribution is created by generating, for each permutation, a random gene set the same size as your specified gene set by selecting that number of genes from all of the genes in your expression data set (or pre-ranked list), and then calculating the enrichment score for that randomly selected gene set. The distribution of those enrichment scores across all of the permutations constitutes the null distribution.
- FDR: corrects for multiple hypothesis testing and enable a more correct comparison of the different tested gene-sets with each other.
note: for a given gene-set S and observed NES, called NES*, FDR is [% of all NES (including permutations) >= NES*] / [% of all observed NES (=NES for all tested gene-sets) >= NES*]

Explanation of GSEA ES score and values from Wang and Murray (BMC Bioinformatics 2013):
Tips on how to install GSEA locally and launch it from the command line:
- Download and Save the gsea2-2.0.14.jar file in your folder Documents
- open your console/terminal window
- Type the command for MAC:
- "java -Xmx2G -jar ~/Documents/gsea2-2.0.14.jar"
- Type the command for Windows:
- "cd Documents"
- "java -Xmx2G –jar gsea2-2.0.14.jar"
answers to questions
- Question: how can we compare the NES (same gene-sets) between different datasets:
1) single sample GSEA case: e.g single sample GSEA was used on several patients and then a matrix of NES is created with the gene-sets as rows and patients as column and you want to find out gene-sets that are comparable between patients. A t-test with 1 group could be used to identify the gene-sets with comparable NES throughout samples --> t = mean/ standard error. The gene-sets will get a pvalue close to 0 only for gene-sets with comparable NES across patients (standard error is going to be small)
- 2) GSEA has been run using GSEA preranked option, you created a map using the 2 datasets and you see that the map is similar (e.g JAK2 responders versus partial responders) (high correlation throughout the gene-sets for the 2 datasets). You can do a K_S (Kolmogorov–Smirnov) test or a Wilcoxon rank sum test on the NES from the 2 datasets to see if "the 2 maps" are different or not.

