|
Size: 822
Comment:
|
Size: 5333
Comment:
|
| Deletions are marked like this. | Additions are marked like this. |
| Line 1: | Line 1: |
| #acl BaderLabGroup:read,write,revert,delete All:read |
|
| Line 3: | Line 5: |
| Here an initial mockup of Factoid UI is described. Please note that this is an initial mockup, so it has some details elided. The focus is on the high-level concepts of the UI. Details, such as particular commands put in menus, can be easily specified later. | Here an initial mockup of Factoid UI is described. Please note that this is an initial mockup, so it has some details elided. The focus is on the high-level concepts of the UI. '''Pictures in this document can be made bigger by clicking on them.''' == Factoid system == The Factoid system has two major parts where UI is concerned: 1. The editor component: The editor component is the part of the UI that centres around the visualisation. 1. The management UI: The management UI concerns user management, document management, and UI wrapped around the editor component in the integrated Factoid system. This document focusses on the editor component, since the management UI is fairly standard compared with the editor component. The management UI is not concerned much with the domain of biology and representing and editing biological data, so it is not described in detail here. == Representation of data == In the editor component, data is represented visually in a [[http://en.wikipedia.org/wiki/Graph_theory|graph]]. [[http://biopax.org/|Biopax]] is used as the data model, and [[http://cytoscapeweb.cytoscape.org/|Cytoscape Web]] is used to draw the graph. Here the visual representation of the various Biopax data types is shown. Please note that this is an initial pallet, and the colours can be improved. [[attachment:vis.png|{{attachment:vis.png|The visualisation style|width=512}}]] |
| Line 9: | Line 30: |
| [[attachment:default.png|{{attachment:default.png|foo|width=640}}]] | [[attachment:default.png|{{attachment:default.png|The editor|width=640}}]] |
| Line 13: | Line 34: |
| The editor makes use of [[http://cytoscapeweb.cytotoscape.org|Cytoscape Web]] for the visualisation of nodes and edges. | [[attachment:embedded.png|{{attachment:embedded.png|The editor embedded in an external website}}]] Here the editor is shown as it would be from the Factoid website (from the management UI); the editor is integrated. [[attachment:system.png|{{attachment:system.png|The editor within the Factoid system|width=640}}]] == Representation of metadata == The editor makes use of [[http://cytoscapeweb.cytotoscape.org|Cytoscape Web]] for the visualisation of nodes and edges. Entities are represented by nodes and relationships are represented by edges connected to relationship nodes. This affords the system the ability to represent more complex relationships, such as n-ary directional relationships. [[attachment:rel.png|{{attachment:rel.png|Relationships with Cytoscape Web}}]] == The information panel == The information panel contains information that supplements the Cytoscape Web visualisation. [[attachment:panel.png|{{attachment:panel.png|The information panel}}]] Initially, the panel contains information about the paper associated with the metadata. The information about the paper is shown also when there is no selection made in the Cytoscape Web visualisation. When an element in the Cytoscape Web visualisation is selected, information about that element is shown in the information panel. [[attachment:panel_node.png|{{attachment:panel_node.png|The information panel with a node selected|width=640}}]] The information shown for the paper, nodes, and edges will be defined in a later document. It suffices to show here that the panel is flexible enough to afford many data types, such as text, charts, et cetera. The information panel can be closed and opened by clicking the arrow button in the top-right corner of the panel. [[attachment:panel_closed.png|{{attachment:panel_closed.png|The information panel closed|width=640}}]] == Tooltip menus == A tooltip menu is shown when an element is clicked. The tooltip menu allows a user to quickly manipulate the graph. Where possible, direct manipulation is used to manipulate the graph, and the tooltip menu helps to keep the interaction close to the elements being manipulated. [[attachment:qtip.png|{{attachment:qtip.png|The tooltip menu|width=640}}]] [[attachment:qtip_hover.png|{{attachment:qtip_hover.png|The tooltip menu over "Rename"|width=640}}]] The tooltip menu can change to accomodate additional parameters once a command has been selected. This gives the tooltip menus flexibility in that many types of commands can be accommodated. [[attachment:qtip_edit.png|{{attachment:qtip_edit.png|The tooltip menu in editing state|width=640}}]] == The menu == The menu accommodates commands that aren't covered by the tooltip menus. Some commands do not correspond to particular elements in the visualisation: These commands may be global, for instance. These commands can be put in the menu. [[attachment:menu.png|{{attachment:menu.png|The menu|width=640}}]] == TODO == Define * Commands * for entities * for interactions * global commands * Biopax data exposed * in commands * in visual display in information panel * Is visualisation representation useful? * Can it be improved? * Is anything confusing? * Are there any usual colour conventions, for example? * Is there anything else that can be reused from GeneMANIA? |
Factoid mockup
Here an initial mockup of Factoid UI is described. Please note that this is an initial mockup, so it has some details elided. The focus is on the high-level concepts of the UI.
Pictures in this document can be made bigger by clicking on them.
Factoid system
The Factoid system has two major parts where UI is concerned:
- The editor component: The editor component is the part of the UI that centres around the visualisation.
- The management UI: The management UI concerns user management, document management, and UI wrapped around the editor component in the integrated Factoid system.
This document focusses on the editor component, since the management UI is fairly standard compared with the editor component. The management UI is not concerned much with the domain of biology and representing and editing biological data, so it is not described in detail here.
Representation of data
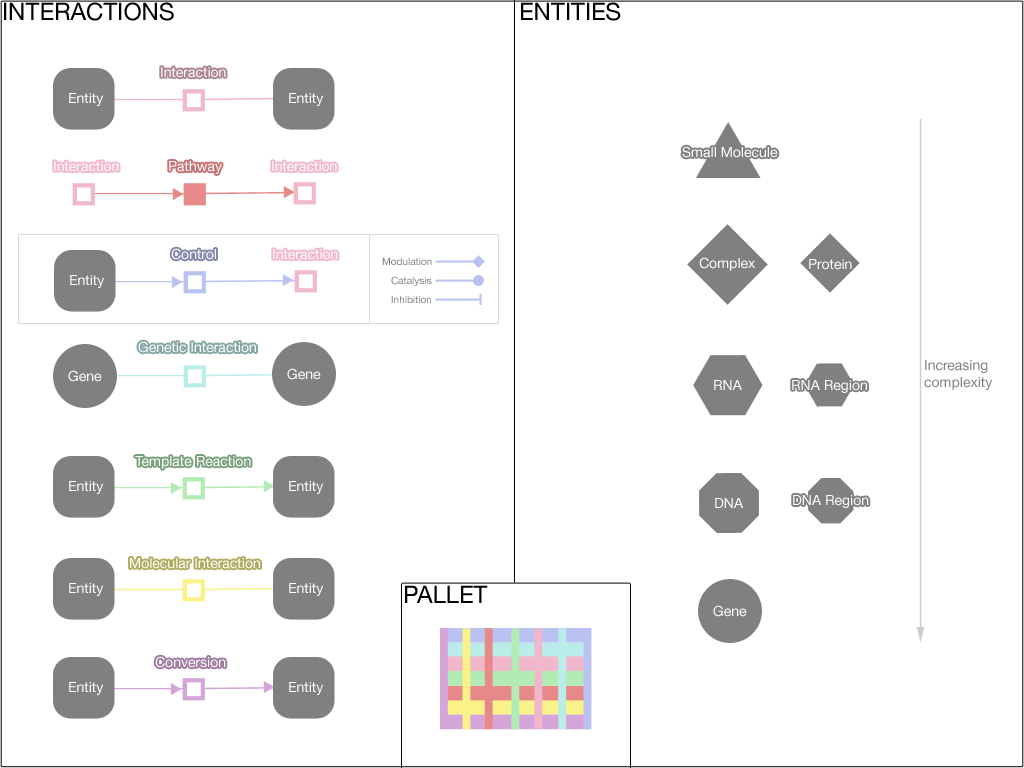
In the editor component, data is represented visually in a graph. Biopax is used as the data model, and Cytoscape Web is used to draw the graph.
Here the visual representation of the various Biopax data types is shown. Please note that this is an initial pallet, and the colours can be improved.
Editor component
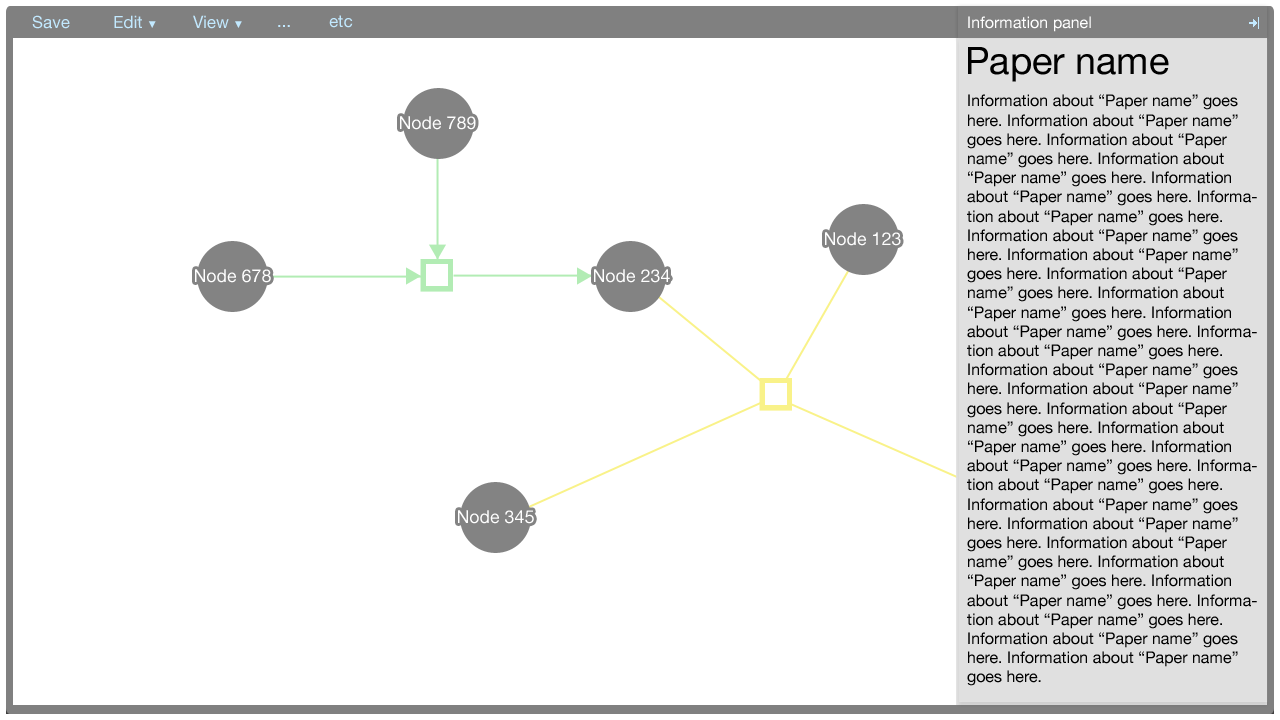
The editor component exists in the Factoid system to allow an author to modify the metadata associated with one of his papers. The editor is shown below.
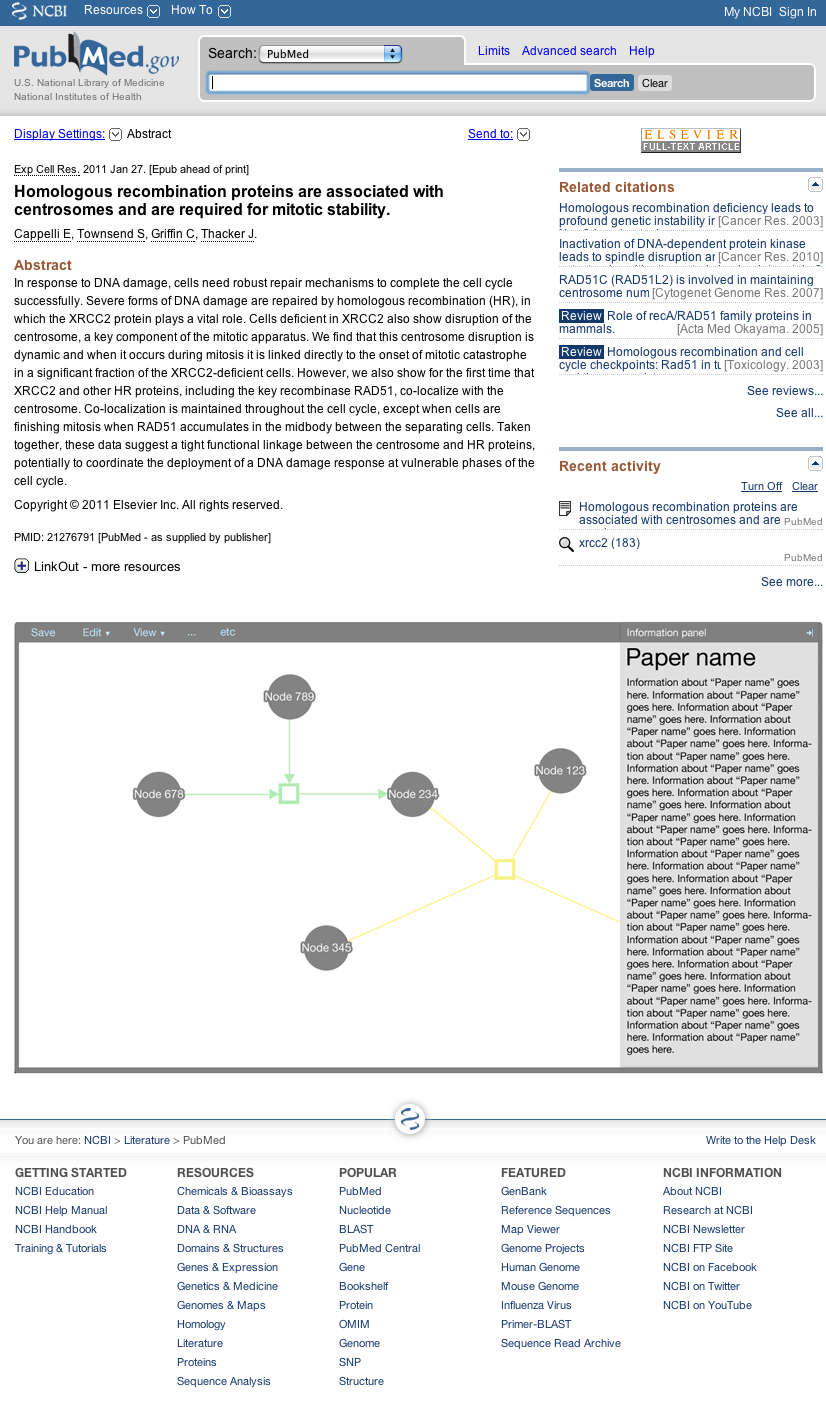
The editor is a part of the Factoid system, and the editor can also be embedded as a part of an external website as a part of its paper submission process.
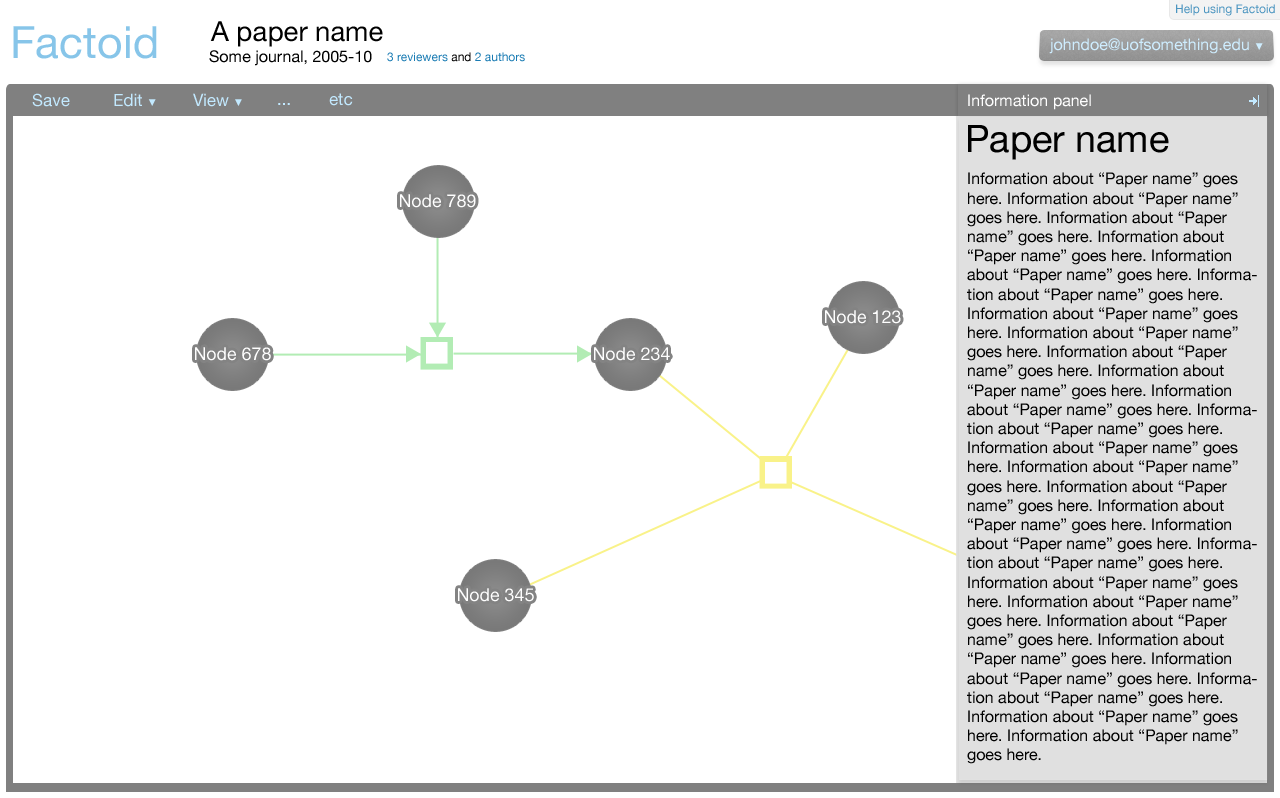
Here the editor is shown as it would be from the Factoid website (from the management UI); the editor is integrated.
Representation of metadata
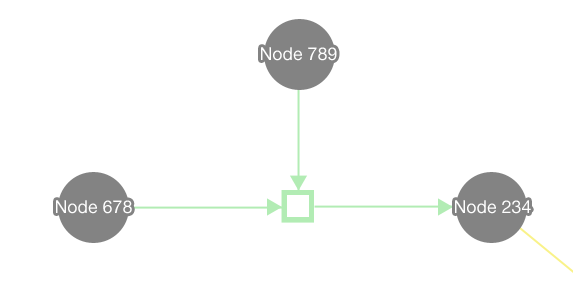
The editor makes use of Cytoscape Web for the visualisation of nodes and edges. Entities are represented by nodes and relationships are represented by edges connected to relationship nodes. This affords the system the ability to represent more complex relationships, such as n-ary directional relationships.
The information panel
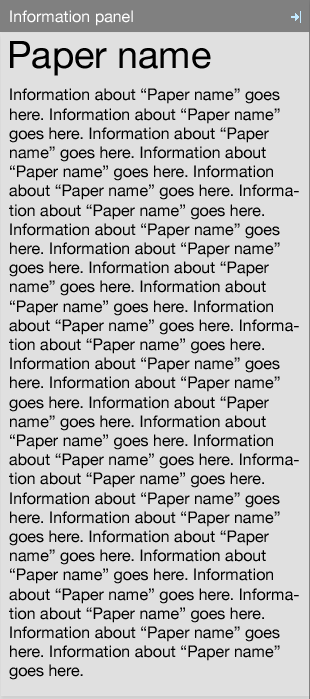
The information panel contains information that supplements the Cytoscape Web visualisation.
Initially, the panel contains information about the paper associated with the metadata. The information about the paper is shown also when there is no selection made in the Cytoscape Web visualisation.
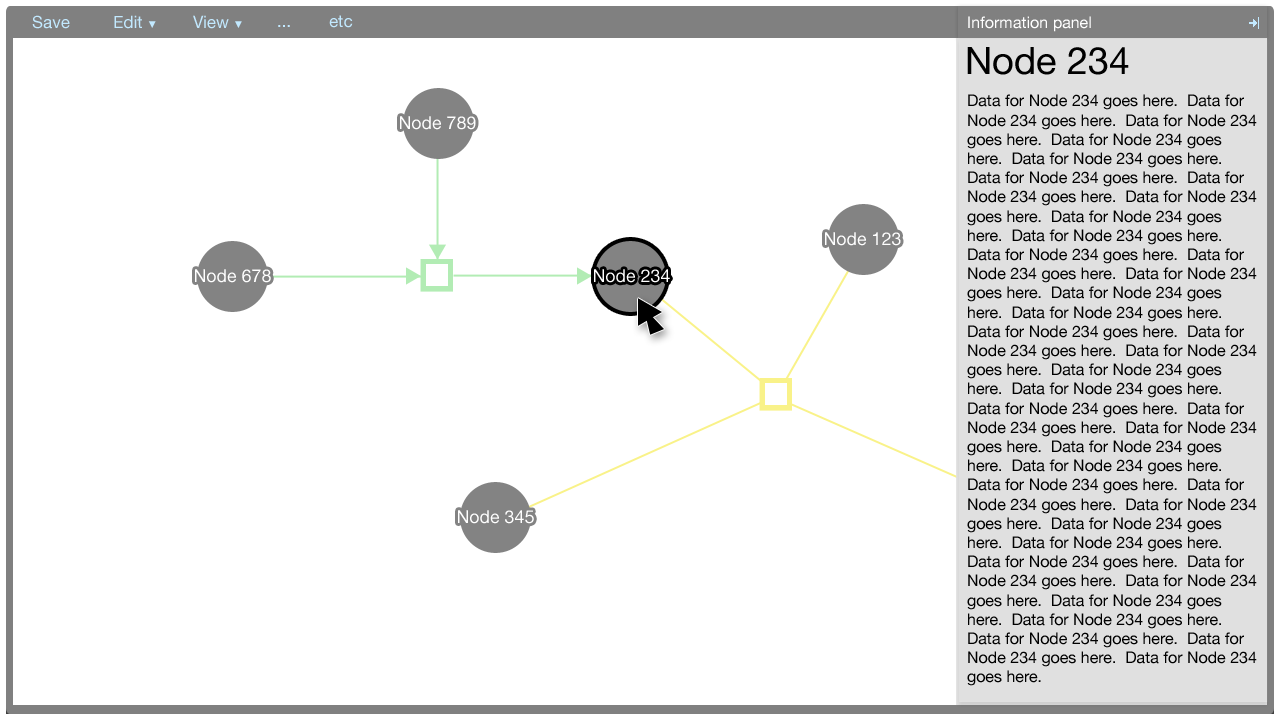
When an element in the Cytoscape Web visualisation is selected, information about that element is shown in the information panel.
The information shown for the paper, nodes, and edges will be defined in a later document. It suffices to show here that the panel is flexible enough to afford many data types, such as text, charts, et cetera.
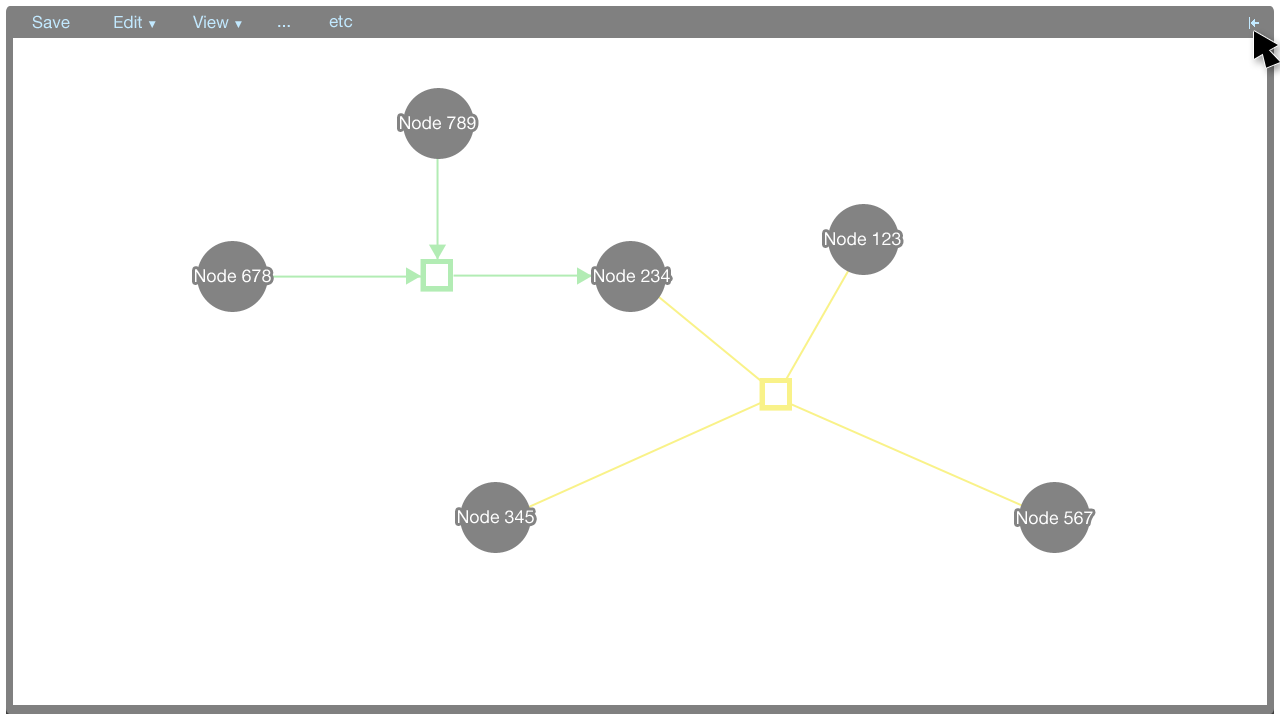
The information panel can be closed and opened by clicking the arrow button in the top-right corner of the panel.
Tooltip menus
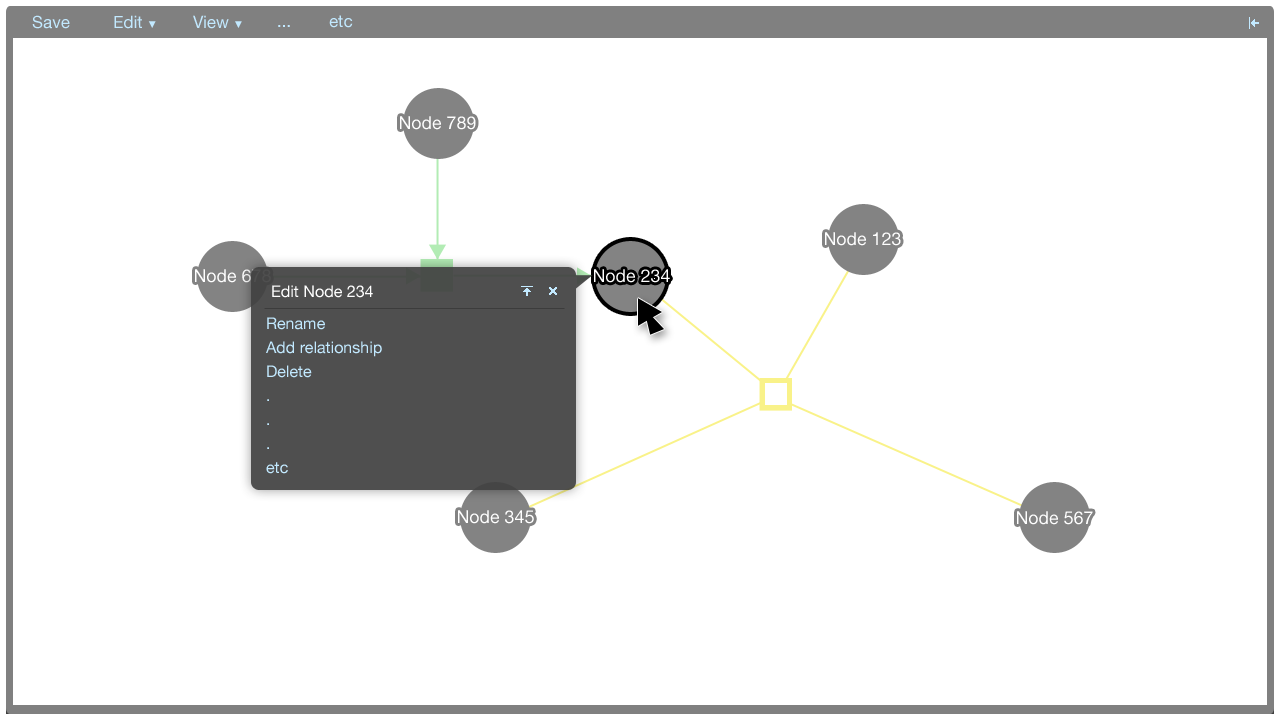
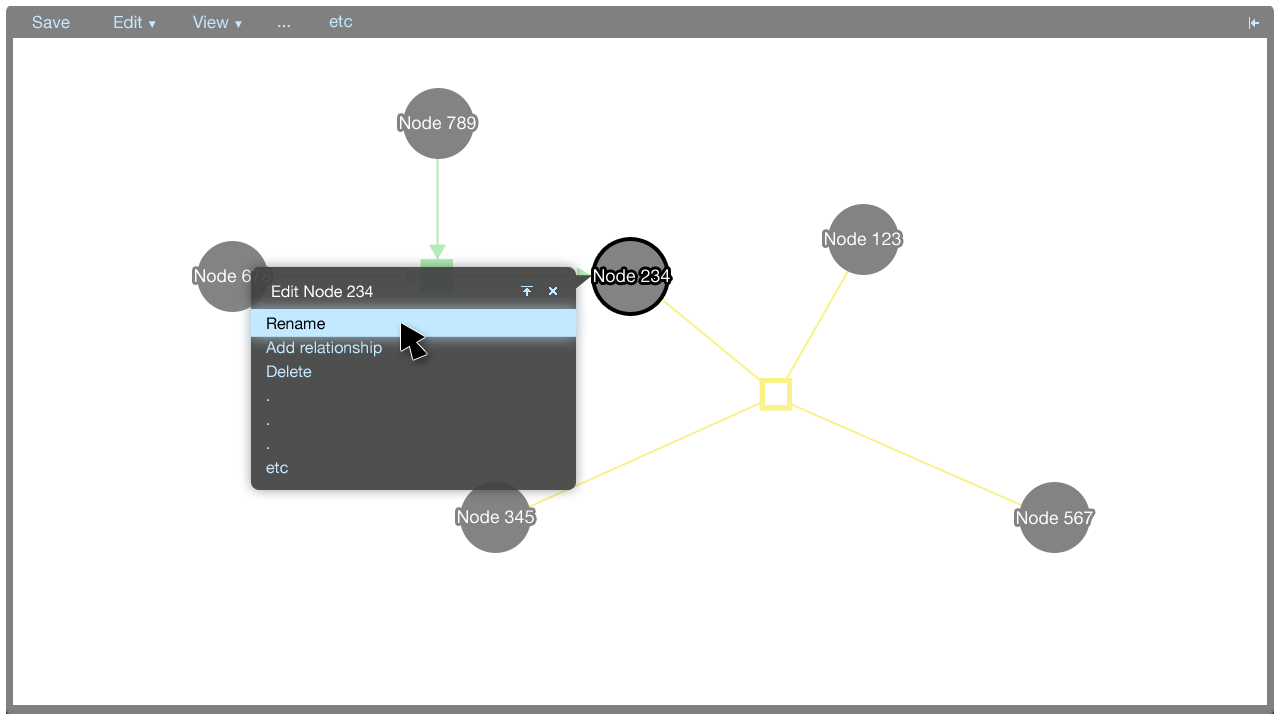
A tooltip menu is shown when an element is clicked. The tooltip menu allows a user to quickly manipulate the graph. Where possible, direct manipulation is used to manipulate the graph, and the tooltip menu helps to keep the interaction close to the elements being manipulated.
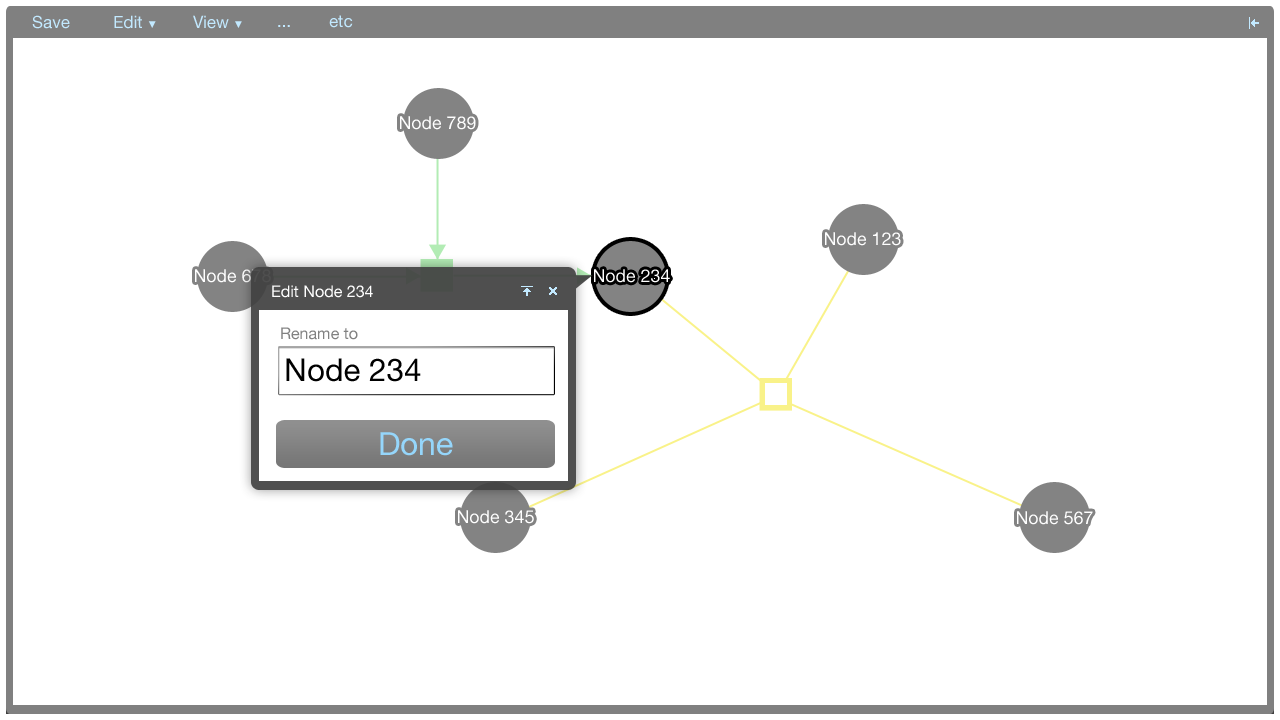
The tooltip menu can change to accomodate additional parameters once a command has been selected. This gives the tooltip menus flexibility in that many types of commands can be accommodated.
The menu
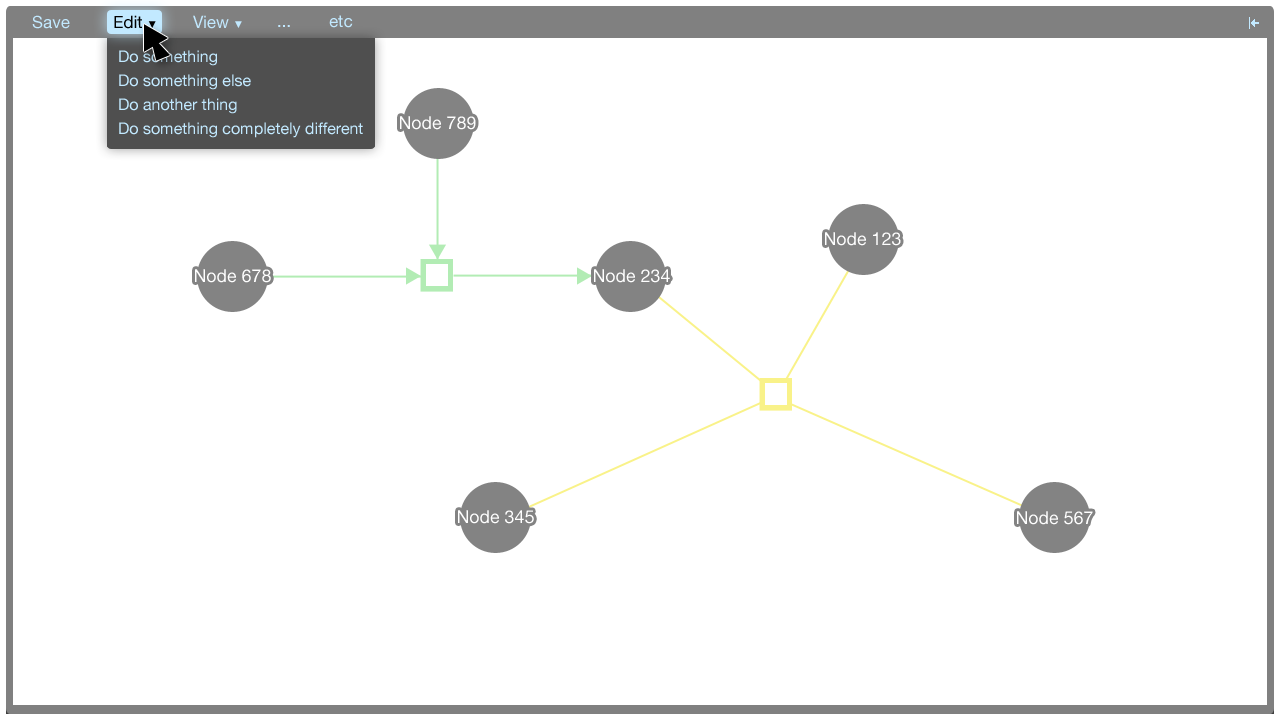
The menu accommodates commands that aren't covered by the tooltip menus. Some commands do not correspond to particular elements in the visualisation: These commands may be global, for instance. These commands can be put in the menu.
TODO
Define
- Commands
- for entities
- for interactions
- global commands
- Biopax data exposed
- in commands
- in visual display in information panel
- Is visualisation representation useful?
- Can it be improved?
- Is anything confusing?
- Are there any usual colour conventions, for example?
- Is there anything else that can be reused from GeneMANIA?

