Factoid mockup
Here an initial mockup of Factoid UI is described. Please note that this is an initial mockup, so it has some details elided. The focus is on the high-level concepts of the UI.
Pictures in this document can be made bigger by clicking on them.
A note to the reader
The purpose of this document is to determine whether the UI that is described here at a high level is adequate for Factoid. If adequate---or after made adequate---the UI for the editor will be described in further detail to serve as a requirements document.
This document is paired with the Factoid requirements specification document. This document specifies the implementation details of the project, while the other document describes the system functionally without much regard to implementation.
Please make comments on things that can be added, removed, or changed to make improvements.
Factoid system
The Factoid system has two major parts where UI is concerned:
- The editor component: The editor component is the part of the UI that centres around the visualisation.
The management UI: The management UI concerns user management, document management, and UI wrapped around the editor component in the integrated Factoid system.
This document focusses on the editor component, since the management UI is fairly standard compared with the editor component. The management UI is not concerned much with the domain of biology and representing and editing biological data, so it is not described in detail here.
To summarise, the management UI gives a user access to his list of papers for which he has access; it also gives a user access to administrative tasks, such as rolling back to a previous version of paper metadata.
The management UI is mocked up in another document.
Representation of data
In the editor component, data is represented visually in a graph. Biopax is used as the data model, and Cytoscape Web is used to draw the graph.
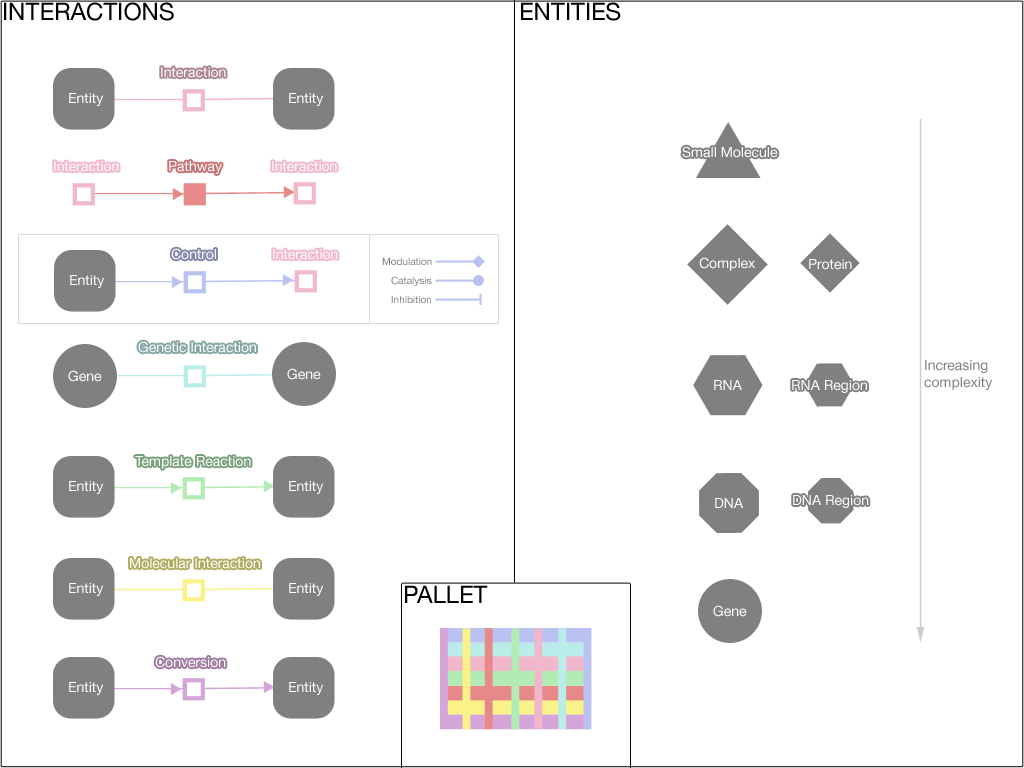
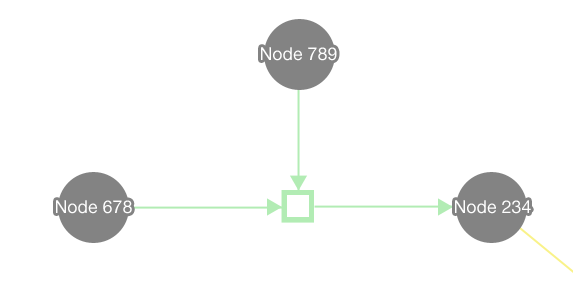
Here the visual representation of the various Biopax data types is shown. Please note that this is an initial pallet, and the colours can be improved.
Conventions:
- Entities are in grey and vary in shape to indicate the type of entity
- Entities that are more complex have more sides
- Relationships are in colour and vary the hue to indicate the type of relationship
- Pathways are filled with colour, while lower level relationships are an outline of colour
- Control arrowheads
- The arrowhead on the edge from a control substance to a control relationship indicates the type of control (catalysis, inhibition, etc)
- The arrowheads on the edge form the control relationship to the controlled interaction indicates the directionality of the reaction that is controlled
- Entity nodes are large in size and relationship nodes are small; this makes relationships better match the size of edges to create an association via size similarity
Editor component
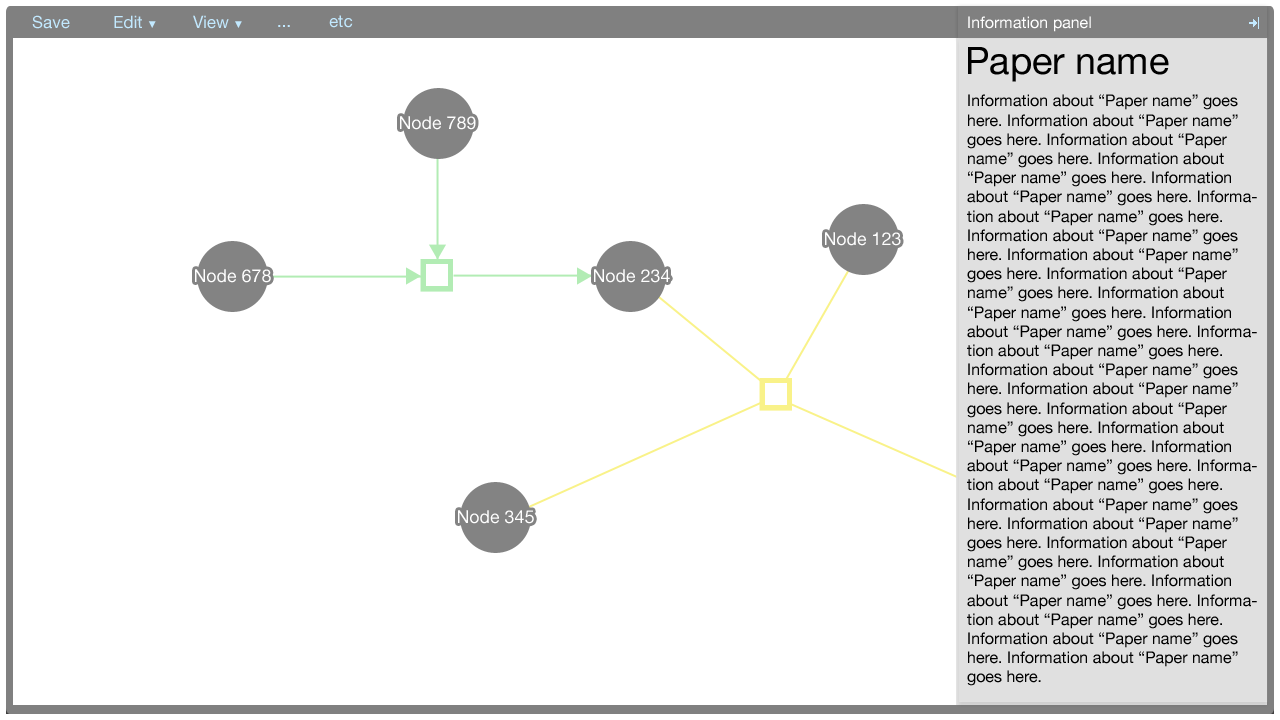
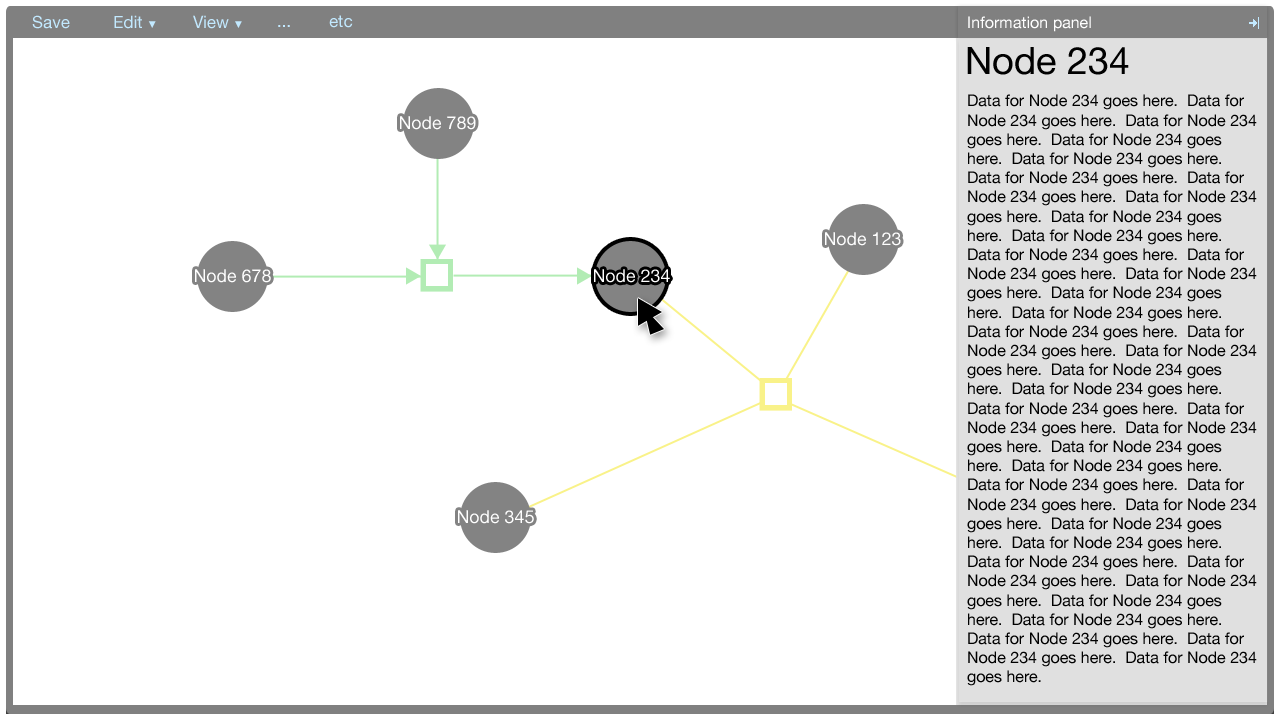
The editor component exists in the Factoid system to allow an author to modify the metadata associated with one of his papers. The editor is shown below.
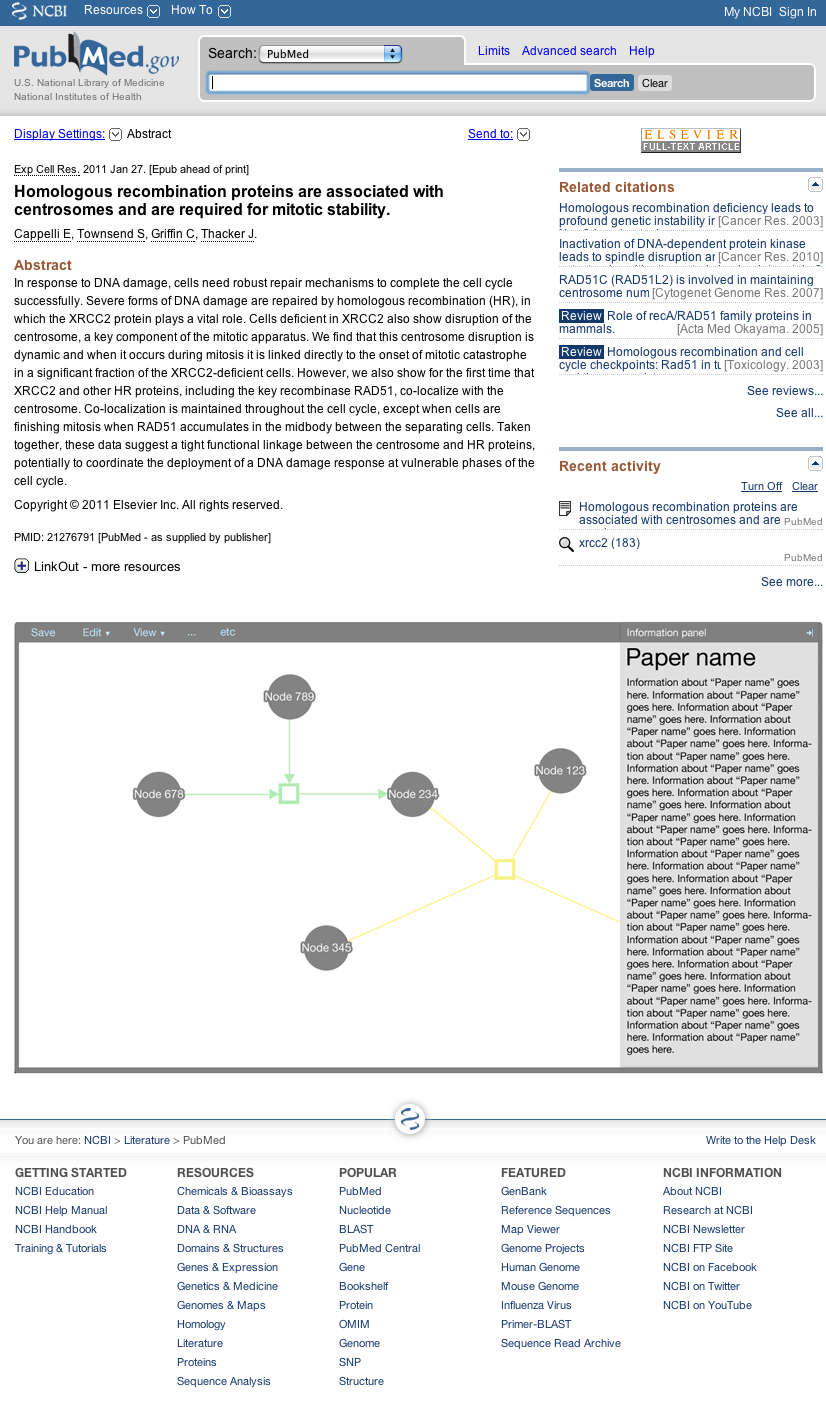
The editor is a part of the Factoid system, and the editor can also be embedded as a part of an external website as a part of its paper submission process.
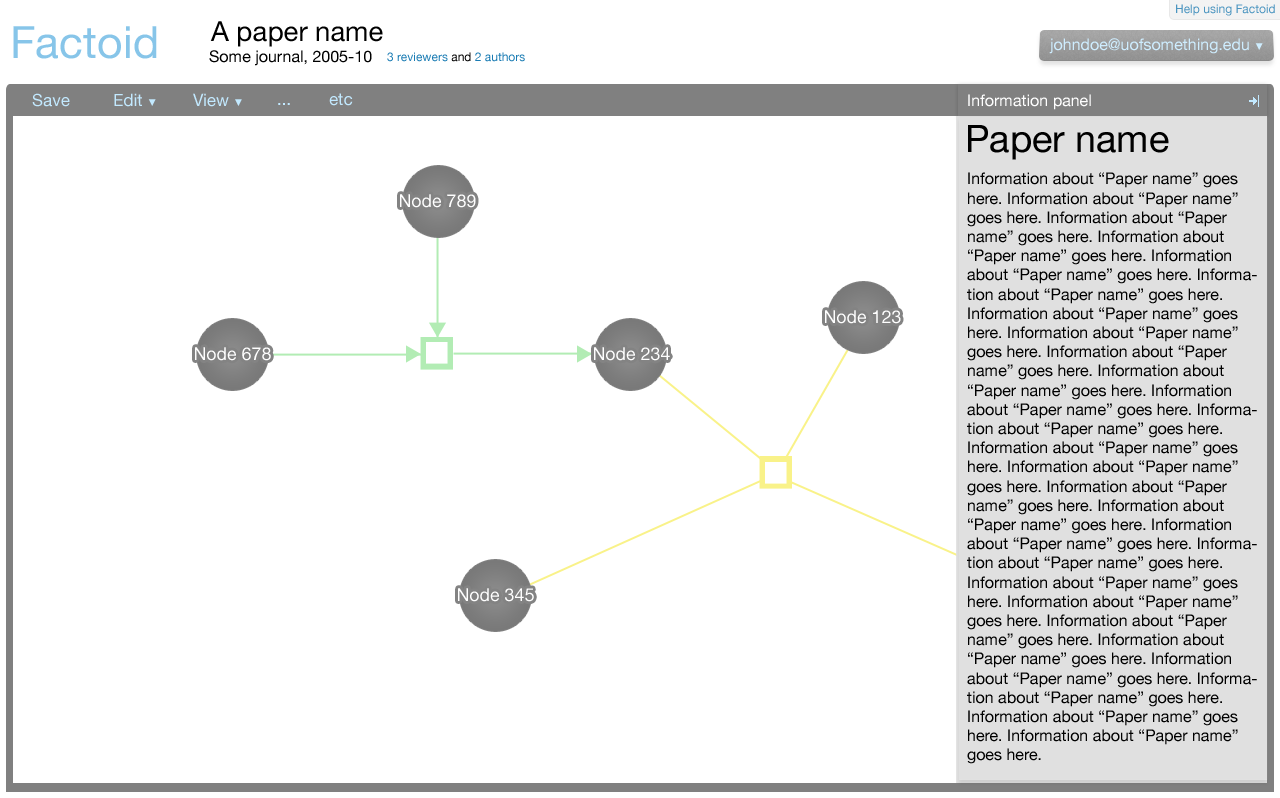
Here the editor is shown as it would be from the Factoid website (from the management UI); the editor is integrated. If the user comes from the management UI, this is what would be shown. (It allows the user to go back and access the management UI, for example.)
Representation of metadata
The editor makes use of Cytoscape Web for the visualisation of nodes and edges. Entities are represented by nodes and relationships are represented by edges connected to relationship nodes. This affords the system the ability to represent more complex relationships, such as n-ary directional relationships.
The information panel
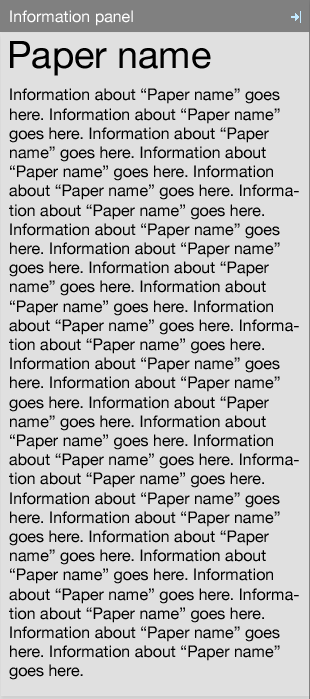
The information panel contains information that supplements the Cytoscape Web visualisation.
Initially, the panel contains information about the paper associated with the metadata. The information about the paper is shown also when there is no selection made in the Cytoscape Web visualisation. The information about the paper could contain a synopsis of the data within the graph, for example.
When an element in the Cytoscape Web visualisation is selected, information about that element is shown in the information panel.
The information shown for the paper, nodes, and edges will be defined in a later document. It suffices to show here that the panel is flexible enough to afford many data types, such as text, charts, et cetera.
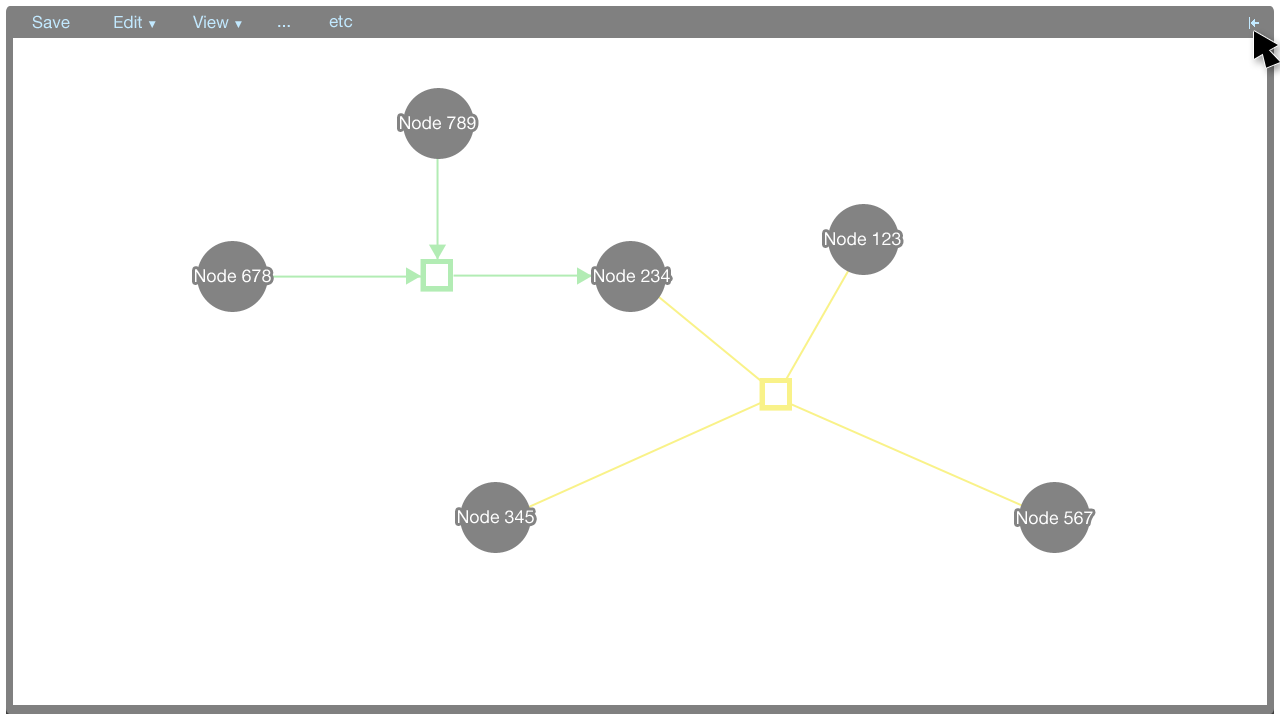
The information panel can be closed and opened by clicking the arrow button in the top-right corner of the panel.
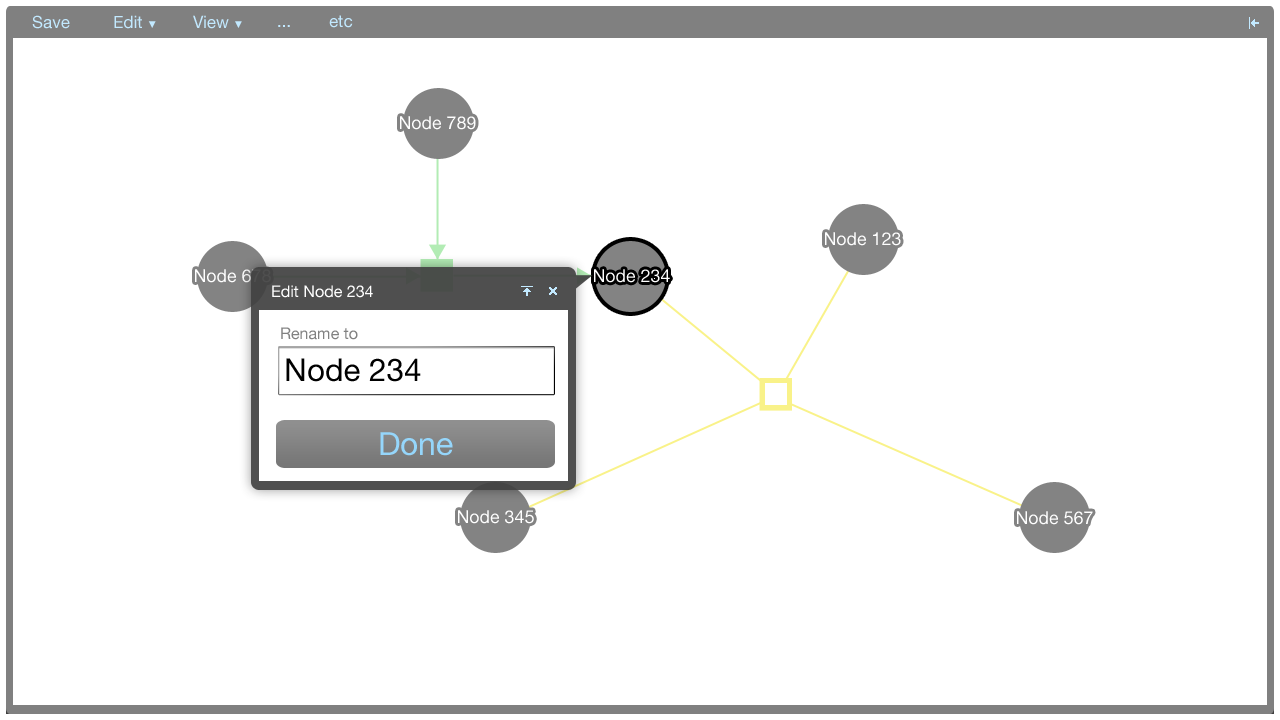
Here, an editor screen for the name of the selected node in the tooltip menu is shown.
To readers: What types of information would be useful for users to see in the information panel for (1) the paper, (2) an entity, (3) a relationship?
Tooltip menus
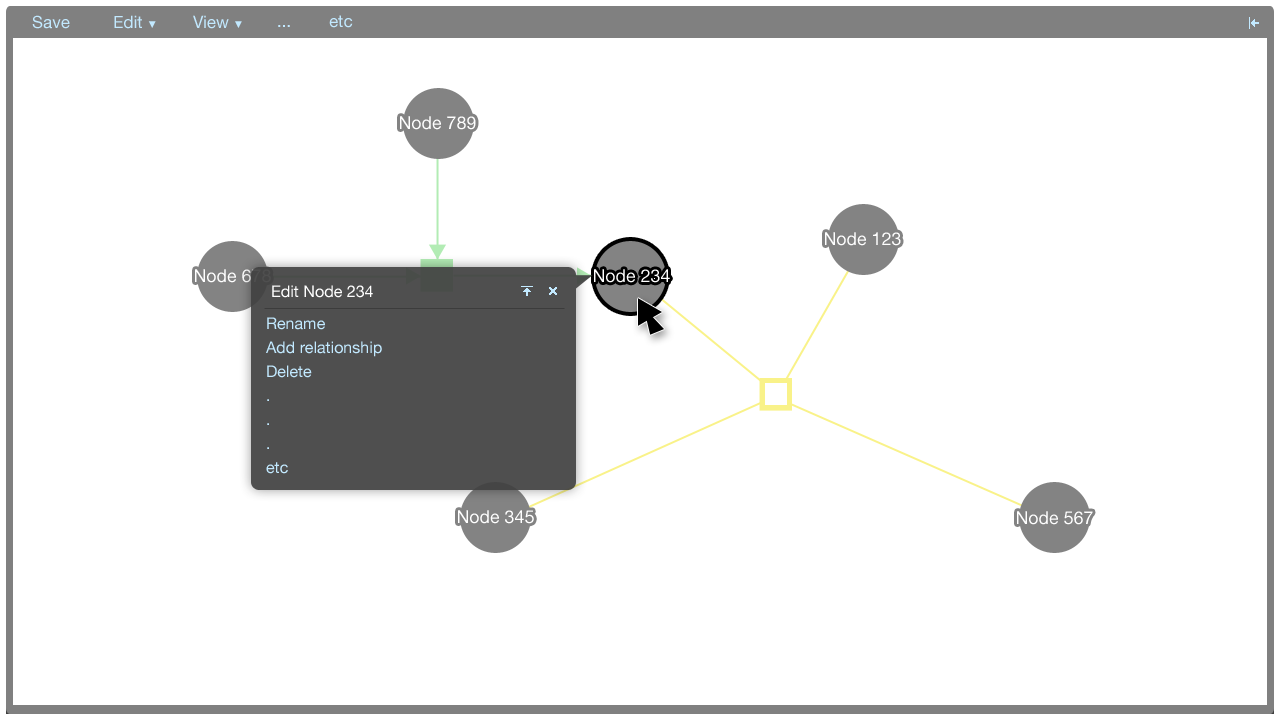
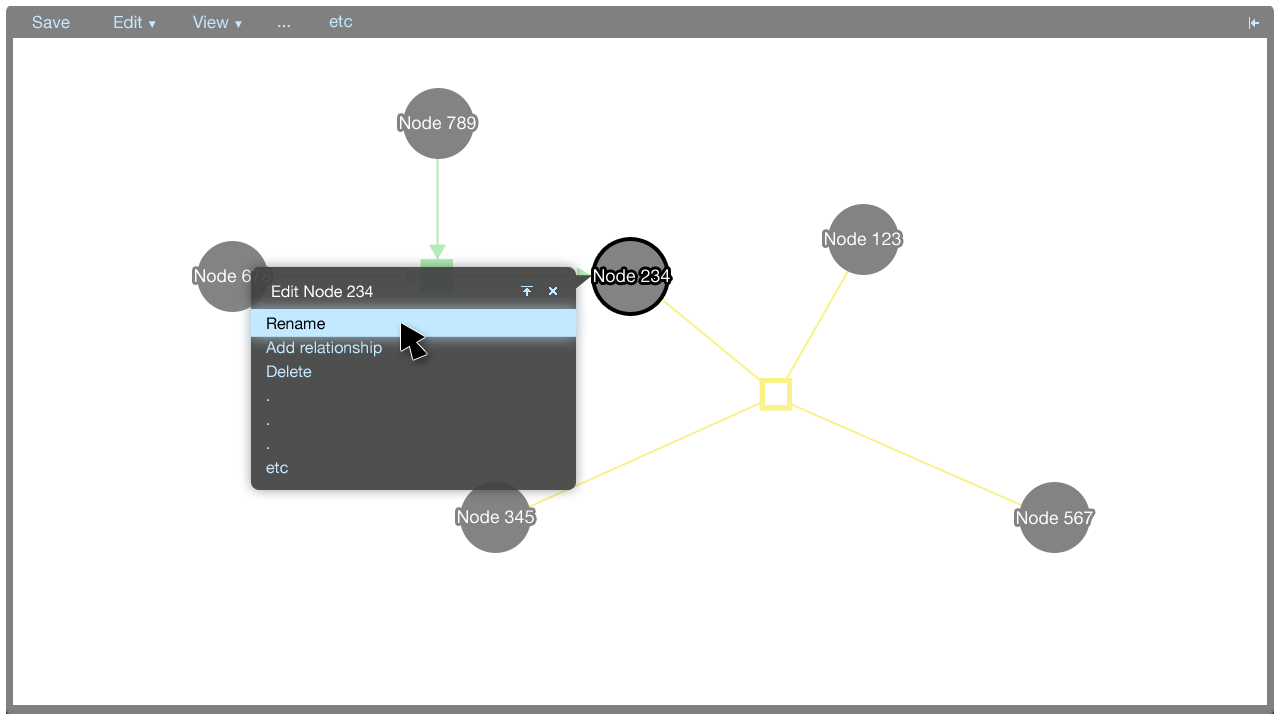
A tooltip menu is shown when an element is clicked. The tooltip menu allows a user to quickly manipulate the graph. Where possible, direct manipulation is used to manipulate the graph, and the tooltip menu helps to keep the interaction close to the elements being manipulated.
The tooltip menu can change to accomodate additional parameters once a command has been selected. This gives the tooltip menus flexibility in that many types of commands can be accommodated.
Tooltip menu commands
Entities
- Link to relationship: Connect an edge from this entity node to a relationship node
- Rename: Rename this entity
- Delete: Remove this entity from the visualisation
- Modify metadata: Modify BioPAX metadata for this entity (Note: this may not be necessary for entities if we can pull enough metadata from the server when the user enters the entity's name---for example if gene xrcc2 is entered, we can populate the entity with pre-existing metadata)
Relationships
- Link to entity: Connect an edge from this relationship node to an entity node
- Rename: Rename this relationship
- Delete: Delete this relationship from the visualisation
- Modify metadata: Modify BioPAX metadata for this entity
All Biopax data fields for the entities and relationships should be exposed to the user in the information panel and ones that the user needs to edit should be editable in the tooltip menu.
To readers: Are there any commands that would be useful to add here?
The menu
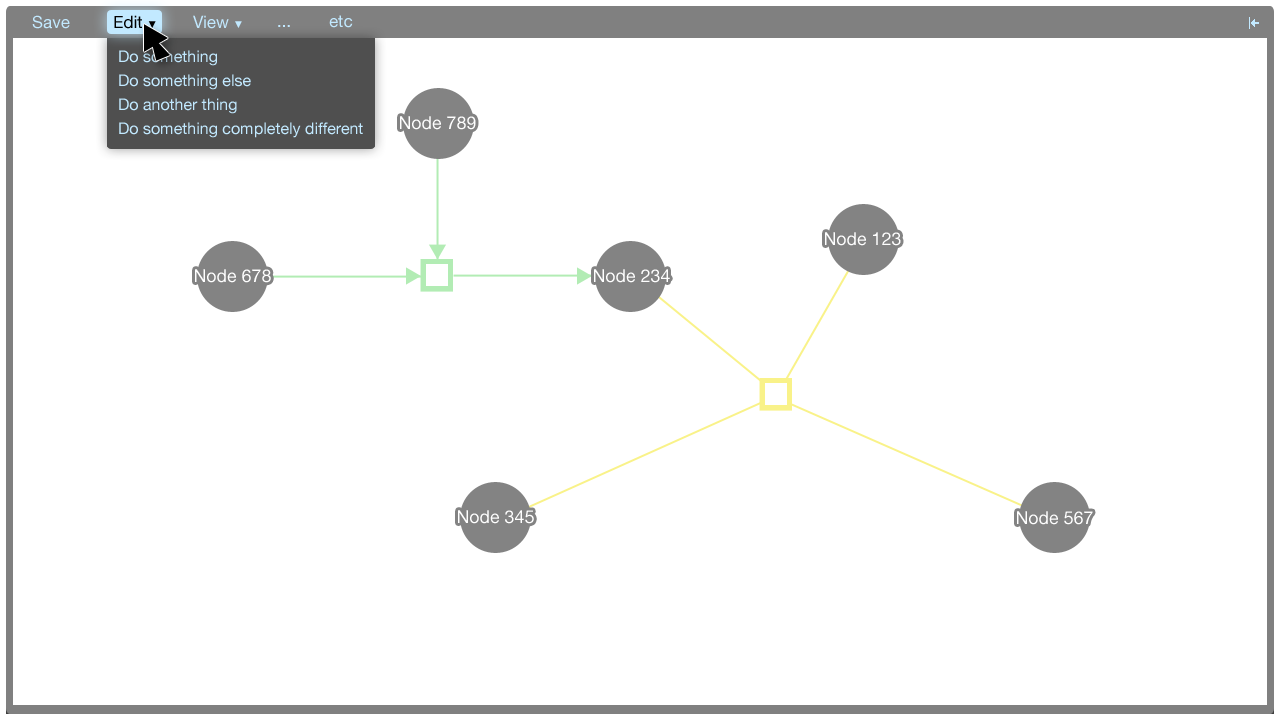
The menu accommodates commands that aren't covered by the tooltip menus. Some commands do not correspond to particular elements in the visualisation: These commands may be global, for instance. These commands can be put in the menu.
Menu commands
- Save
- Add entity
- Small molecule
- Protein
- Complex
- RNA
- RNA region
- DNA
- DNA region
- Gene
- Add relationship (Subclasses of these types can be specified in a tooltip menu on creation.)
- Interaction
- Control
- Genetic interaction
- Template reaction
- Molecular interaction
- Conversion
- Pathway
- Delete
- View
- Layout entities and relationships
- Show labels
- Show pan-zoom control
To readers: Are there any commands that would be useful to add here?
Double clicking
Double clicking on whitespace acts as a shortcut to add an entity or a relationship. A tooltip menu is shown where the user double clicks, allowing the user to select which type of entity or relationship to add. The user can then use the regular tooltip menu to modify the entity or relationship.

