Contents
TIPS ON HOW TO USE ENRICHMENTMAP AND CYTOSCAPE (provided by the bioinformatics service and EnrichmentMap software developpers)
Description of the page:
this page collects tips on how to use EnrichmentMap and Cytoscape based on frequently asked questions and known issues.
it is based from received feedback from and tailored to the need of the OICR Cancer Stem Cell users (http://oicr.on.ca/oicr-programs-and-platforms/innovation-programs/cancer-stem-cell)
do not hesitate to contact us if you need any assistance while executing these steps or have issues not reported on this page (veronique.voisin@gmail.com)
for description on our workflow or how to create a maps, please visit these pages : http://www.baderlab.org/VeroniqueVoisin/Intranet/Protocol, http://www.baderlab.org/Software/EnrichmentMap
TIPS SECTION STARTS HERE:
Cytoscape 3.2
- runs on java7
- java7 is installed by default on (recent) Windows machines but not on MAC machines which run java 1.6 by default.
- To install java 7, you don't need to uninstall java 6 first;
- Once you installed java 7,open your terminal window and type "java -version"; if the terminal tells you java version "1.6.x_xx", you may type this command "export JAVA_HOME=$(/usr/libexec/java_home -v 1.7)" to run java 7
see instructions here: here if you have an older Snow Leopard 10.6.8 and need to upgrade to java 7
you can use this script to upgrade your cytoscape 2.8 session files:convert_cyto_28_to_3_EM.sh or use the manual procedure described in the Cytoscape 3.1.1 section
- the recommended enrichmentmap version for Cytoscape 3.2 is the enrichmap version that contains the automatic annotation option (Release 2.1.0 )
- more on java folders and set JAVA_HOME environment variable to Java 7 path:
How to collapse group nodes into a single metanode (in order to simplify the map)
use cytoscape 3.2.1 or later and latest EnrichmentMap version (built 627 or later)
- manual creation of groups and manual collapsing of nodes (1 by 1)
- create a group of nodes:
- select nodes to form a group
right click on the selected nodes and choose the option "group" ==> "group selected nodes" ==> name it
- double click on the group on the node to collapse it.
- to expand a metanode, double-click on it and the individual nodes forming the group will be displayed.
- create a group of nodes:
- automatic options
add automatic labels using the "Annotate Cluster" feature (in menu --> EnrichmentMap --> Annotate Cluster)
run the "Annotate Cluster" with the option "Create Groups for clusters" checked (Control Panel --> Annotation Panel --> Advanced Option --> Create Groups for clusters).
- Collapse all the groups:
menu bar ==> Tools ==> Command Line Dialog
- type: group collapse grouplist ="all"
- examples of help commands
- help group
- help group collapse
- once the metanodes are created, we can change their size, color , shapes as other nodes. We also can import attributes for these nodes.
How to create a signature gene-set to use with the post-analysis option of enrichmentmap
- take the list of genes that you want to overlap with the map
- make sure the gene identifiers of your list is the same as the ones used to create the enrichmentmap (e.g Gene Symbol)
open a new Excel workbook and transform the cell format to test (menu --> format --> cell --> text)
- leave the first 2 column emptys and paste using the special/ transpose option to paste your gene list horizontally on the Excel worksheet (first line)
- give a name and description of your list in the first 2 columns
- save it as a tab delimited file and then change the extension from .txt to .gmt
- once your gene signature .gmt file has been created, you can follow this protocol:
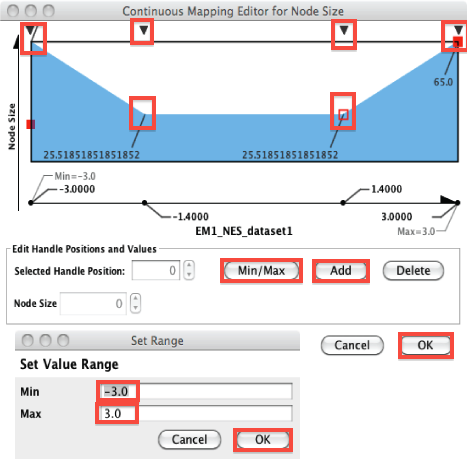
Modify the node size to be proportional to GSEA NES (normalized enrichment score)
- red nodes have NES with positive values and blue nodes have NES with negative values
Go to Control Panel --> Style -- Size --> expand the right arrow
- in Column, change EM1_gs_size_dataset1 to EM1_NES_dataset1
- double-click on the current mapping diagram (blue and white rectangle)
- set the min and max to -3 and 3 respectively
- add 2 tabs using the "Add" button and set the new tabs to 1.4 and -1.4 and the x axis
- on the y axis, set the nodes values to
- 65 for -3
- 25 for -1.4
- 25 for 1.4
- 65 for 3
- click on "OK" to apply the changes

Cytoscape 3.1.1
recommended version of EnrichmentMap is 2.0.1 (Oct 5, 2014)
- runs on java 6 or 7
Open an existing enrichment map session file (.cys) (Oct 5, 2014)
- to fully open a stored session: open Cytoscape first and then the session file.
Create a figure (manual annotation) with an EnrichmentMap in Cytoscape 3.1.1 [Sept 23, 2014]
- How to create a figure with manual annotation of the functional modules (note: an automatic annotation function will be soon available for Cytoscape 3.2):
- Change the background to white:
- in Control Panel
--> Style
--> at the bottom, select Network
--> Background Paint: choose the white color and click on OK
- in Control Panel
- remove the labels:
- go to Table Panel
-> double check that you have the focus on Node Table
--> Click on the 5th Symbol item to create a "New Single Column" --> Integer
--> name this new column "no_labels"
go to Control Panel --> Style
- make sure that the focus is on "Node" (at the bottom)
change Label --> Column to "no_labels"
- go to Table Panel
- Export the network as a pdf:
- arrange the nodes and the view as you would like them to appear on the figures (e.g red nodes on the left and blue nodes on the right)
- Click on the icon "Export Image to File"
--> choose the PDF format, browse to your desired folder, choose a name and click on "OK"
- Open a powerpoint document and import the pdf file:
looking at the labels of single nodes or using the application WordCloud to look at the labels of a group of nodes, manually annotate the map on your powerpoint slide.
- Change the background to white:
Move label position of nodes (Oct 5, 2014)
- go to Style in the Control Panel and click on the word "Properties" (it gives a list of all properties)
--> choose "Label Position" (this property is now added to the list) and double click on the first box (icon with a rectangle box) to move the labels to desired position)
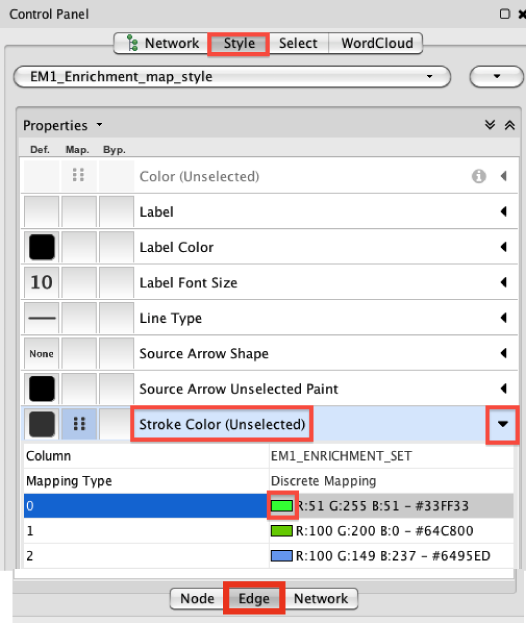
Change Edge Color (Nov 14, 2014)
- go to "Style" in "Control Panel" and chose at the bottom the "Edge" Panel.
- Look for "Stroke Color (Unselected)" and click on the arrow (right) to expand the panel
- click on a colored rectangle to change the color. By default, green is for dataset 1 and blue is for dataset2 in the case that you created a map with 2 datasets.
- click on a colored rectangle to change the color. By default, green is for dataset 1 and blue is for dataset2 in the case that you created a map with 2 datasets.
- Look for "Stroke Color (Unselected)" and click on the arrow (right) to expand the panel
Cytoscape 2.8
To use Cytoscape 2.8, Cytoscape 2.8.3 and version of EnrichmentMap 1.3 is recommended (Sept 23, 2014)
- It is recommended to use the latest version of Cytoscape (Cytoscape 3) to get benefits from new features (unless you can't upgrade to java 7 or 8).
If you have a project done with Cytoscape 2.8 and want to correctly open these files with Cytoscape 3 you can follow this procedure (recommended for experienced users only)(tips created on Sept 23, 2014):
How to make a Cytoscape 2.8 file compatible for Cytoscape 3 :
- open Cytoscape 3.1.1
- open the 2.8 file
- save the file with a new name (e.g. _cyto3)
- change the extension from .cys to .zip for both the old and new files
- unzip the old and new files
copy the folder called Enrichment_Map_plugin (located in the plugins folder) from the old file to the Apps folder of the new file and call it EnrichmentMap (old cyto2.8 file/plugin/Enrichment_Map_plugin --> new cyto3 file/Apps/EnrichmentMap)
- zip the new session with a new name and replace the extension .zip to .cys
zip -r DP_ImmGeneUP_nov18_2013_cyto3_emadded.zip CytoscapeSession-2014_09_18-09_44
- mv DP_ImmGeneUP_nov18_2013_cyto3_emadded.zip DP_ImmGeneUP_nov18_2013_cyto3_emadded.cys


