|
Size: 4290
Comment:
|
Size: 4315
Comment:
|
| Deletions are marked like this. | Additions are marked like this. |
| Line 17: | Line 17: |
| <<Include(Software/EnrichmentMap/Tutorial,"Description of the tutorial files contained in the GSEATutorial folder",2, from="^== Description of the tutorial files contained in the GSEATutorial folder ==$")>> | <<Include(Software/EnrichmentMap/Tutorial,"Description of the tutorial files contained in the GSEATutorial folder",2, from="^== Description of the tutorial files contained in the GSEATutorial folder ==$", to="== Instructions ==")>> |

Enrichment Map Tutorial Direct from GSEA Interface
Contents
Outline
This quick tutorial will guide you through the generation of an Enrichment Map for an analysis performed using GSEA Gene Set Enrichment Analysis directly from the GSEA interface.
To run this tutorial
- You need to have Cytoscape installed : minimally 2.6.3 must be installed but preferable to have the latest version of Cytoscape 2 (e.g. 2.8.3)
- It does not work with Cytoscape 3
You need a version of GSEA that supports the direct creation of Enrichment Maps. (FILL IN VERSION NUMBER WHEN IT GETS RELEASED)
You need to download the test data: GSEATutorial.zip
Include: Nothing found for "^== Description of the tutorial files contained in the GSEATutorial folder ==$"!
Include: Nothing found for "== Instructions =="!
Description of the tutorial files contained in the GSEATutorial folder

Enrichment Map GSEA Tutorial
This tutorial has been moved to: http://enrichmentmap.readthedocs.io/en/docs-2.2/Tutorial_GSEA.html
This tutorial is based on the older 2.2 version of EnrichmentMap. Newer tutorials are available here: https://baderlab.github.io/Cytoscape_workflows/EnrichmentMapPipeline/
Instructions
Include: Nothing found for "^=== Step 1: Generate GSEA output files ===$"!
Include: Nothing found for "'''Note'''"!
Step 1: Run GSEA

Enrichment Map GSEA Tutorial
This tutorial has been moved to: http://enrichmentmap.readthedocs.io/en/docs-2.2/Tutorial_GSEA.html
This tutorial is based on the older 2.2 version of EnrichmentMap. Newer tutorials are available here: https://baderlab.github.io/Cytoscape_workflows/EnrichmentMapPipeline/
Step 2: Generate Enrichment Map

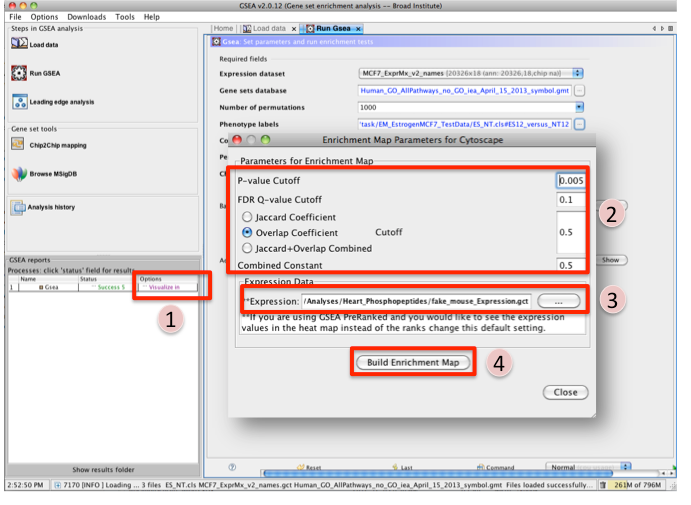
Once GSEA has completed in the GSEA reports panel next to the GSEA analysis you wish to create an Enrichment map for click on Visualize in Cytoscape.
Tune Parameters (check out tips for choosing parameters)
P-value cut-off 0.001
Q-value cut-off 0.05
- Check Overlap Coefficient
Overlap coefficient cut-off 0.5
If you have conducted a GSEA analysis on a Preranked list of genes but wish to see the original expression file associated with your enrichment map update the path to the expression file next to Expression.
- Click on Build Enrichment Map
- Cytoscape should launch and create your Enrichment map.
- Go to View, and activate Show Graphics Details
Step 3: Examining Results
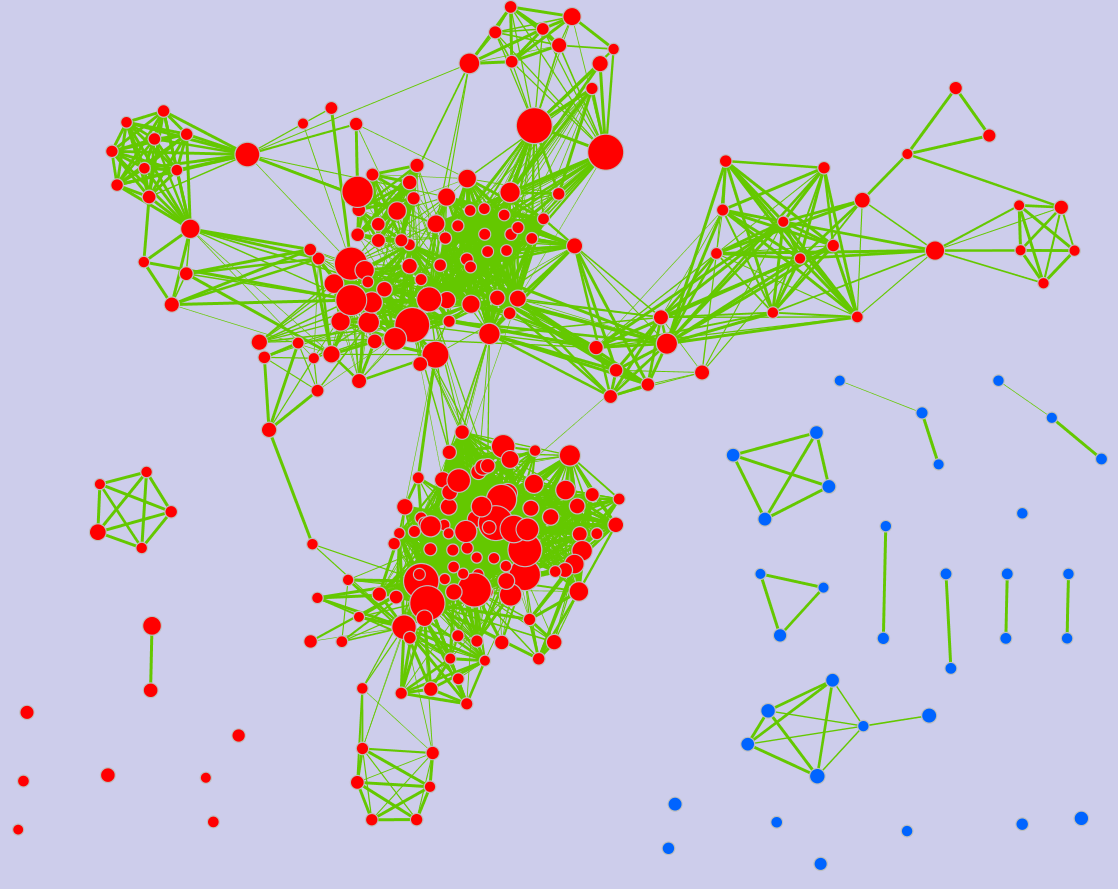
Example EM session - Estrogen treatment vs no treatment at 12hr ES12_EM_example.cys

Legend:
- Node (inner circle) size corresponds to the number of genes in dataset 1 within the geneset
- Colour of the node (inner circle) corresponds to the significance of the geneset for dataset 1.
- Edge size corresponds to the number of genes that overlap between the two connected genesets. Green edges correspond to both datasets when it is the only colour edge. When there are two different edge colours, green corresponds to dataset 1 and blue corresponds to dataset 2.
GSEA Leading Edge Information: 
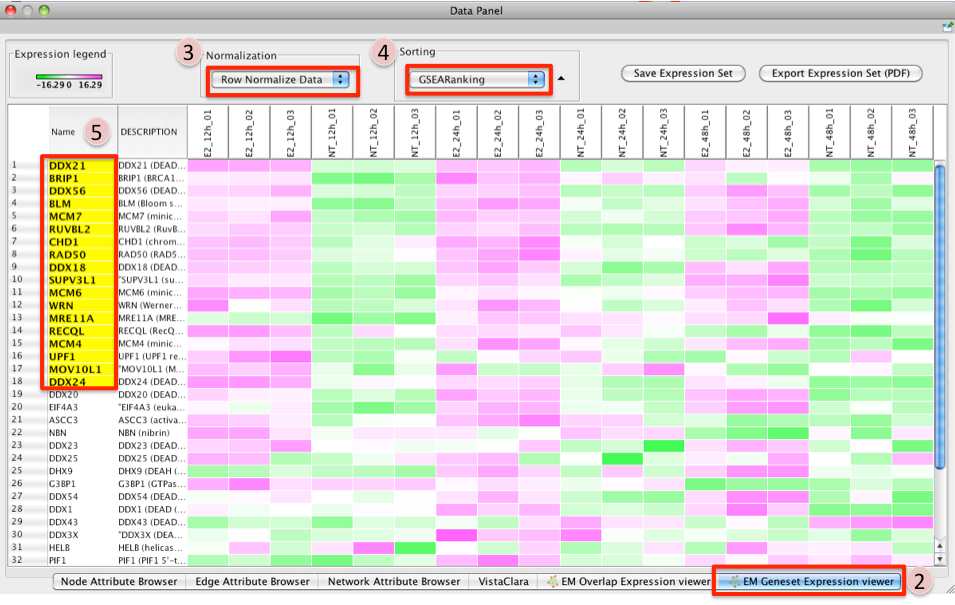
- To access GSEA leading edge information click on an individual Node. Leading edge information is currently only available when looking at a single gene set.
In the Data Panel the expression profile for the selected gene set should appear in the EM GenesetExpression viewer tab.
- Change the Normalization to your desired metric.
Change the Sorting method to GSEARanking.
- Genes part of the leading edge are highlighted in Yellow.
For more detailed tutorials check out:
